In module 2 we looked at creating our first key word automated test project. In that module we touched on a number of key areas of the user interface like the Project Workspace and the Object Browser. Each of those key areas giving us the ability to develop our tests and examine the applications we’re testing.
In this module we’re looking at some other key aspects of the user interface. Key components that you’ll find yourself using on a regular basis to help you develop, debug and run your automated tests.
In the next few paragraphs we’ll go through some of the most useful components within the user interface.
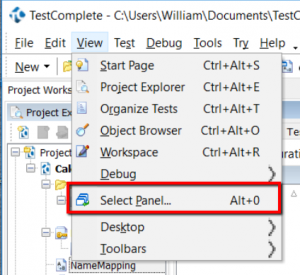
First up then the view menu. In here you’ll find the ‘Select Panel’ option. This option allows you to select which panels you want to display in the TestComplete user interface.
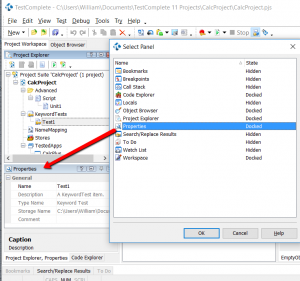
One useful panel is the Properties panel that shows you the properties for each of your test items. For example you can pick a test item, like a keyword test, and see the path and file name to the keyword test on your file system. Useful if you want to back up a particular file. Or if you just want to find out where the complete project suite is located on your file system.
Next then the object spy. This allows us to identify objects in our application using a cross-hair and then inspect their properties and methods.
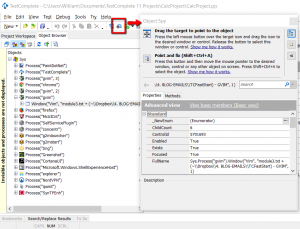
You can either drag the cross-hair over to the object you want to look at. Or you can use the ‘point and fix’ method (put your cursor over the object and press Shift + Ctrl + A). Once you’ve picked out an object you can see the full name for the object, a list of the methods and the properties for the object (more on methods and properties back here).
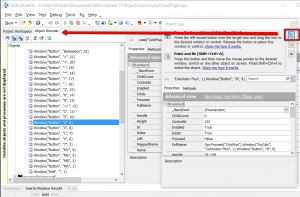
One key feature here (pretty innocuous but very very useful) is the highlight in Object Browser button. Once you’ve identified an object you are interested in click this button and the object will be shown in the object browser. This is useful because you’ll get to see the context and position of the object in relation to it’s parent and child objects. That might not seem important now but it does become absolutely key to getting a good feel for the construction of the application you’re testing as you progress.
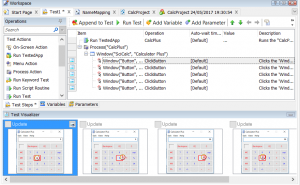
Next up then is the Visualizer. The visualizer is one of the most useful components in TestComplete when it comes to fixing and modifying your scripts. You can configure the Visualizer to take pictures when you record your tests, in which case you’ll see the images in the Key Word test workspace panel.
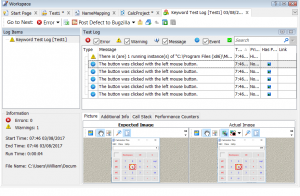
And you can see the comparison ‘Expected’ (from the recorded Keyword test case) and ‘Actual’ (from the test run) in the log files after you’ve run a test.
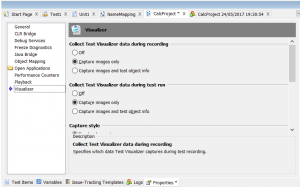
Typically it’s kept on whilst you develop your tests. And also kept on when running your tests for the first few times. You don’t want to keep it on for all your test runs as it’s pretty resource intensive. Once your test are running smoothly you would switch the visualizer off and enable just the ‘post image on error’ setting. This way TestComplete only takes a visualizer image when your tests pick up an error. Visualizer settings are found in the Project Properties tab (more on this later).
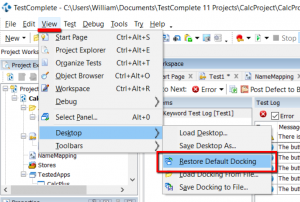
Next on our list of user interface components to look at is the Integrated Development Environment itself. There’s lots you can configure here. Just try dragging different components in the gui and re-arranging them. You can also close panels and open new panels (see above). What usually happens though is that you lose a panel or you just end up with a right mess. At which point you want to return everything to normal and reset. You can do this in the ‘View’ menu.
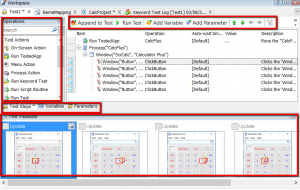
Up next is the Keyword test editor space then. This is where you’ll spend most of your time working. We’ll look at Keyword test development later but for now you just need to know about the main components in this panel. These are…
Test Steps: select this tab and you’ll see the panel where you have a list of all the test steps that make up the Keyword test. We also have the ‘Variables’ and ‘Parameters’ tabs but we’ll talk about those in a later module.
Operations: this panel gives you a list of test actions and other items that you can use in your keyword tests. For example there’s the ‘On Screen Action’ item that you’ll use countless times to complete actions within your application.
Visualizer: Images of the application as these test steps are completed (we’ve talked about this above).
Menu Bar Buttons: this is a panel with a range of buttons used to create and modify your Keyword tests. For example the ‘Append to Test’ button which allows you to start recording again and add more test steps to your Keyword test.
Whilst we’ve covered all the key components in TestComplete IDE there is one last, very important, bit to cover. This is a three step process you’ll use on a regular basis when inspecting, investigating and capturing the objects in your application.
This is VERY IMPORTANT. You may not understand exactly why yet (we’ll come to that as we start building tests) but get into the habit of following these steps. They should be 2nd nature to you before you move on.
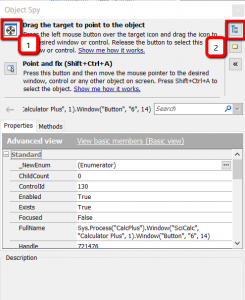
Step 1. Open the object spy and identify the object you’re interested in. Or at least get close to the object you’re interested in (for example if it’s an Html table structure you might find it a bit tricky getting the exact object). Once you’ve identified the object click the “Hightlight Object in Object Tree”.
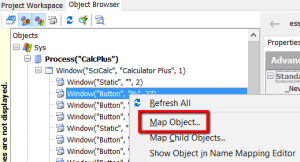
Step 2. At this point you should see the object tree with the object you’re interested in highlighted. Now you really get to see if you’ve picked the right object and you start to get a feel for the context of the object in relation to the rest of the objects in your application.
Now you can look in detail at the object, examine the other related objects and make sure you have the right one. When you have selected the correct object right click and select ‘Map Object’.
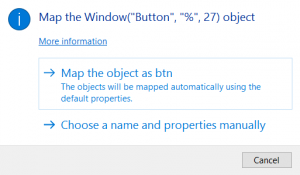
Now if you’re working with a particularly difficult application (e.g. the object are difficult to identify uniquely) then you can opt to ‘Choose a name and properties manually’ or you can just pick the first option and let TestComplete map the object. If in doubt pick the first option for now.
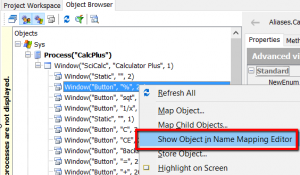
Step 3. The object browser is the list of everything on your system (all processes, windows, browsers, etc). When you map and object, and add it to the Name Map, you’re basically saying to TestComplete add this to the list of object that I’m interested in for my automation project. I don’t want a list of everything on my system, just a list of object I’m interested in for my project. That list is the Name Map.
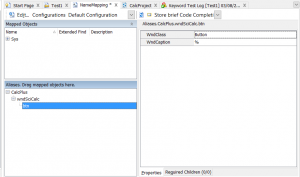
And once you click the ‘Show Object in Name Map’ TestComplete will show you that object in this focused list of objects. This is the list we’ll build that will contain everything we need to know about our application for the purpose of our automation effort.
This might seem convoluted at this point in time. It may seem a little obscure as to why you want to repeat these steps. Just go with it for now though. Practice it a several times to get a feel for jumping between the Object Spy, Object Browser and Name Map. This interaction and movement between the Object Spy, Object Browser and Name Map is key to getting the most out of your automation with TestComplete. You’ll find out exactly why in the coming modules.