As you’ve probably realised what’s underlying all of this automated test case development is code. Behind the scenes your Key Word tests are really code. The artifacts like projects files, checkpoints and name maps are all xml files. Ultimately you’re writing code to test code. And if there’s on thing code has it’s bugs. Yes you’re automated tests will have issues that you’ll need work on to debug. Which is why TestComplete has some debugging tools built in. So that’s what we’re about to look at in this module.
We can break these tools down into three distinct areas….
We’ll go through each of these in the following sections. Starting out with the tools you’ll find in the keyword test case work space.

When you’re editing or developing your key word tests in the TestComplete work space you can right click on a test step/item and you’ll see the menu on the left. In here you’ll find a list of menu items, the first three of which can be useful when debugging your tests.
Run Test: runs the current keyword test (outside of the Project)
Run Selected Operation: runs the highlight test item in isolation
Run From Selected Operation: from the highlighted test item run through to the end
What you’ll typically find is that your tests will run to a certain point then fail. Last thing you want to do is fix an issue and then start right from the beginning again. So use these three options to once you’re at a certain point in your application and you just want to run a select set of tests steps.
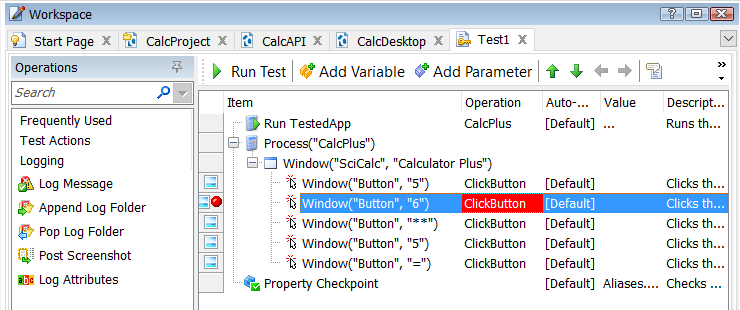
The other point that’s really important when you’re in the test case work space is that you can set Break Points. A break point is a point you specify where your test run will stop (or break) and pause. Whilst paused you can use a set of tools to investigate what’s going on. To set break points just click once in the left hand menu against the step that you need to stop at. Once set when you run your test your test will stop and pause just before it runs this step.
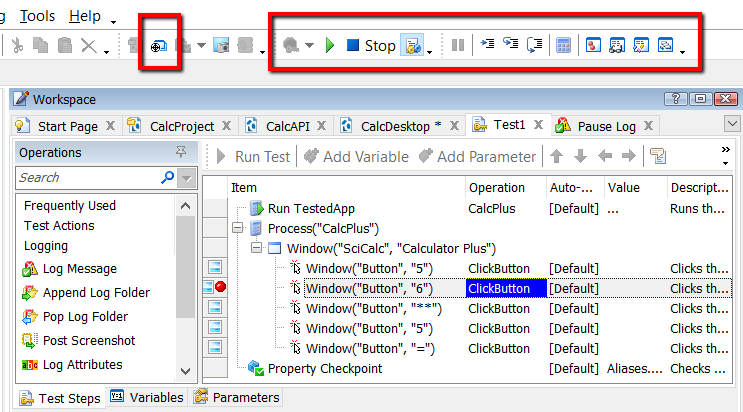
When your script is paused you’ll see the line it’s paused on highlighted and the debug menu bar highlighted. This menu bar presents you with a number of options.
Play — Continue to run your test
Stop — Stop your test
Enable/Disable Debugging — switch off (or on) the debugging feature. Switch off if you want to continue to run through to the end even if you have other break points defined later in your tests.
Pause Execution — not enabled once you’ve hit a break point because you’re already paused. However, can be clicked during your test run if you want to stop in and debug something before you hit a break point.
Run to Cursor — Runs the test up to the cursor and stops, just as if there had been a break point at the cursor location.
Step Into — Executes the next step in the test. If another test or routine is called, the debugger continues on the first line of the test or routine.
Step Over — Executes the next step in the test. If another test or routine is called, the debugger executes the entire call at once and continues on the next line after the test or routine.
Evaluation Dialog — Opens the Evaluate Dialog. The dialog allows you to view and modify variables, expressions and objects.
Breakpoints, Watch List, Locals and Call Stack –– These buttons display panels of the same names and are described in the “Exploring Debugger Panels” topic.
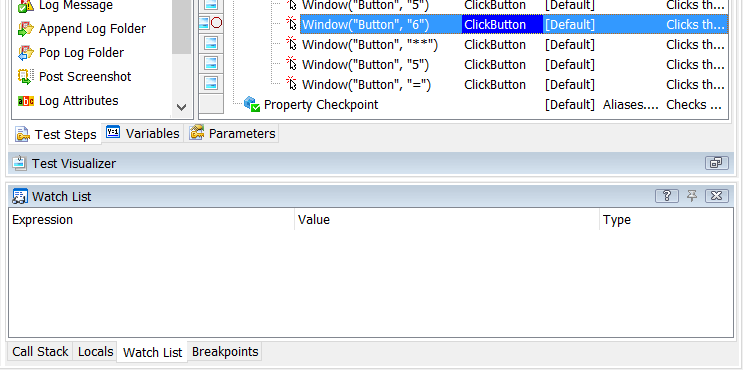
Once you’re paused in debugging mode you’ll see you have some new panels displayed displayed below the test case work space. These panels are:
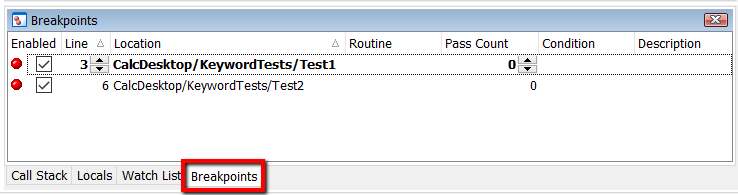 This panel shows a list of all the breakpoints currently set in your project. The highlighted line is the point where you have currently paused at a break point,. From here if you need to you can disable and enable individual breakpoints before you continue to un-pause and run the test.
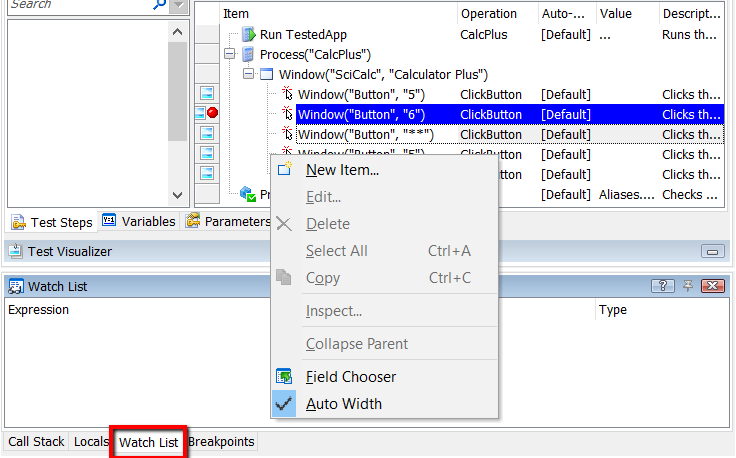 The watch list panel allows you to add code expressions that will get evaluated when you stop at a break point. Useful for working out what a particular variable is set to or a parameter is when the test has executed.
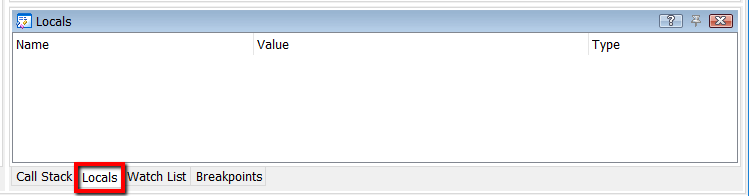 The locals panel is similar to the watch list. However, here you don’t have to add values. The values that are local to this test (e.g. defined on the tests variables list) will be displayed here.
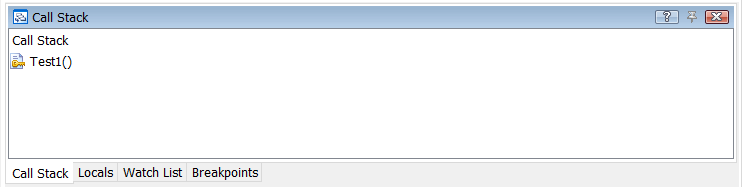 The call stack tab shows you the traceability between test case calls. So if the 1st test case calls the 2nd test case and the 2nd test case has a break point this will show that stack of calls from the 1st to the 2nd (and further if there are more calls). This helps to identify what was happening outside of the test case before the break point in the current test case kicks in.
I think the only definitive thing to say is that as your tests become more complex and you build larger sets of tests you’ll end up relying on this more and more. Don’t worry too much now about the detail. Just understand the concepts and work out how to set a break point. Then as things grow you’ll soon get to practice working with the debugging features in TestComplete.
So long as there’s code there will be bugs. So, reluctantly, I have to assure you that you’ll end up with bugs in your code. Even if that code is test automation code.
Bit ironic really 🙂