In this Moudule we’re focusing on running our performance and load tests. We’ll create some simple scripts in JMeter and link the execution of these scripts into our build process with Jenkins. Once our Selenium functional tests and our SoapUI REST API tests are complete we’ll kick off these JMeter tests. The setup of this will cover these topics:
1. Install JMeter
2. Configure and Create Performance Tests
3. Add and Configure Jenkins Performance Plugin
4. Deploy and Run all our test jobs
To keep things simple we’ll use JMeter to test the performance using the Rocket Chat Rest Api. This will allow us to focus on the key concept of building the automation framework rather than getting to hung up on writing the performance tests. You’ll be pleased to know, at this point in the course, it’s a pretty straight forward process of adding JMeter to the Jenkins configuration.
Yet again we’ll add a new plugin to Jenkins (the ‘Performance Plugin’) which allows us to consume the test result reports from JMeter and display them graphically within Jenkins. We’ll work out how to configure the JMeter tests on our Windows Master machine but we’ll deploy them to a Linux machine for execution. This approach will serve you well for future larger performace tests where you might want to start running distributed performance tests.
What You’ll Learn
The aim is to assess the performance of the build once the application is built and installed. We’re looking to catch issues where performance degredation occurs after changes have been made to the code base. To this end our Jenkins configuraiton will not only kick off the performance tests but it will also asses the performance statistics from one build to the next. If the performance degrades from one build to the next by say 10% then we’ll get Jenkins to notify us.
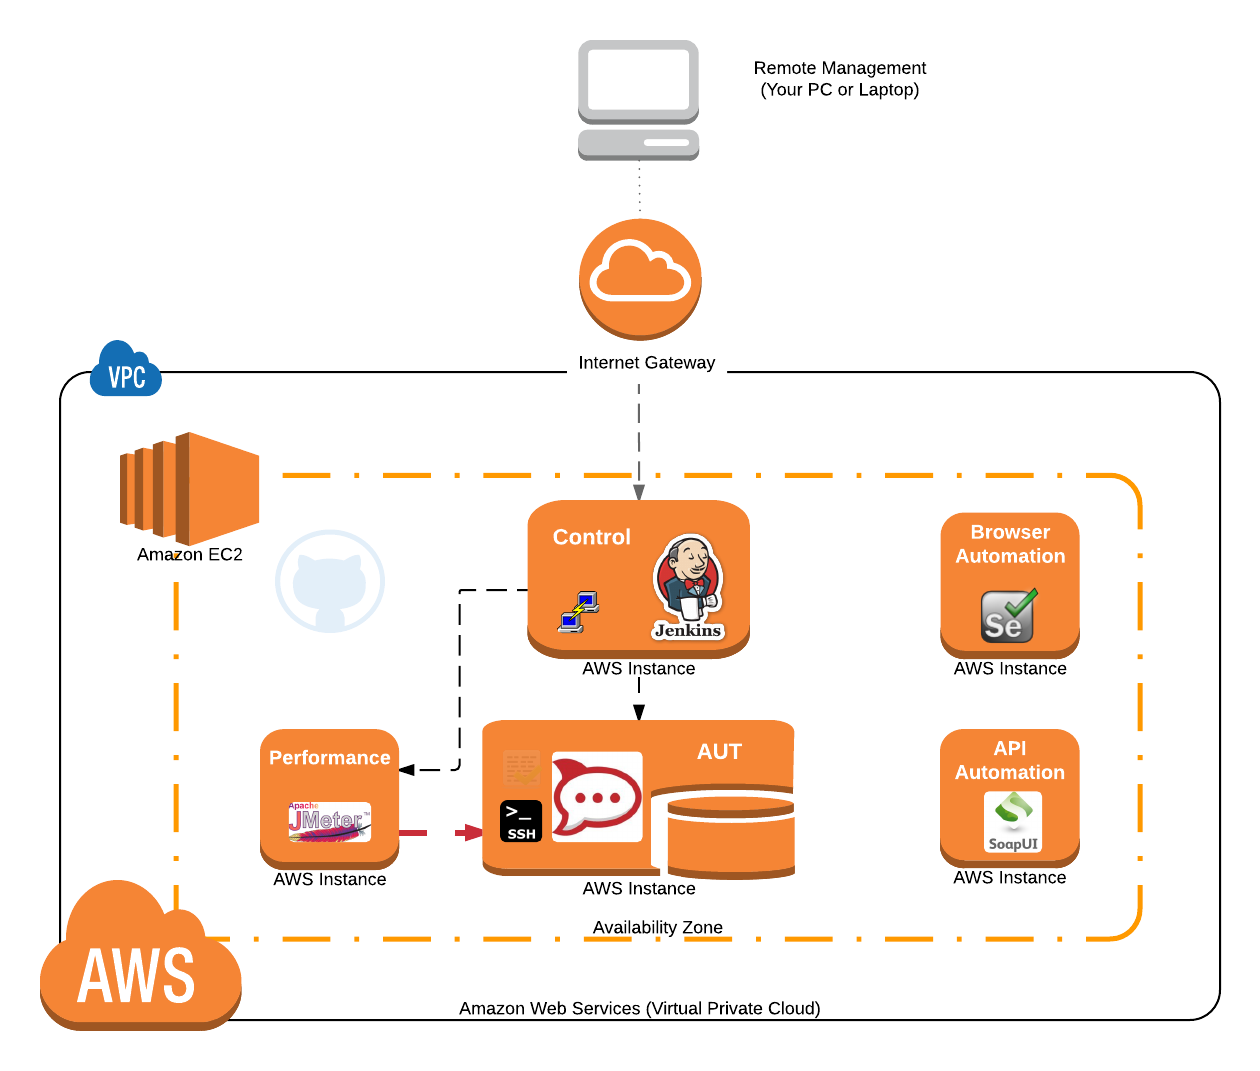
To acheive this we’ll need to have these pieces in place on our test automation rig:
As we’ve already mentioned this isn’t just going to be about running Performace tests. We’ll need to create the tests on the Windows master machine using the JMeter GUI. Then we’ll distribute the JMeter configuration and tests to a Linux machine for execution.
The Tools We’ve Chosen
We’re using JMeter mainly because of it’s popularity and it’s wide use within the industry. Mind you that’s no good if it doesn’t support our technical requirements. We need to create REST Api requests, listen for the REST responses and then store the test results.
Another reason for using JMeter is that there is a Jenkins ‘Performance’ plugin that supports JMeter. This plugin allows us to process the log files created by Jenkins and create some neat charts. You can never have too many charts!
It’s also worth mentioning that JMeter runs (under Java) on both Windows and Linux platforms. We can create tests using the GUI on our Windows Master test machine. We can also run these tests from a Linux machine from a command line when we need to. Again this is all about being able to run from the command line – which is the simplest way to approach things when using Jenkins.
Prerequisites
If you’ve followed upto Module 4 so far you should already have your Amazon Virtual machine environment up and running along with Jenkins, Selenium and SoapUI. This existing setup gives us the 2 machines we’ll need to use in this module.
- Windows Master machine: this is running Jenkins and controlls all our other machines (including the installation of the AUT and the exection of our Selenium tests). This machine will be responsible for kicking off our SoapUI API tests
- Linux Client machine: this Ubuntu linux machine is run up on demand by Jenkins and then has the AUT (Rocket Chat) autoamtically installed on it. This machine provides the web interface for the Rocket Chat application and the API for the Rocket Chat application.
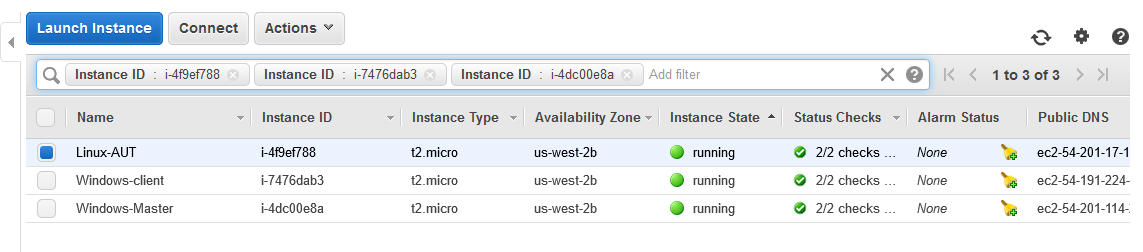
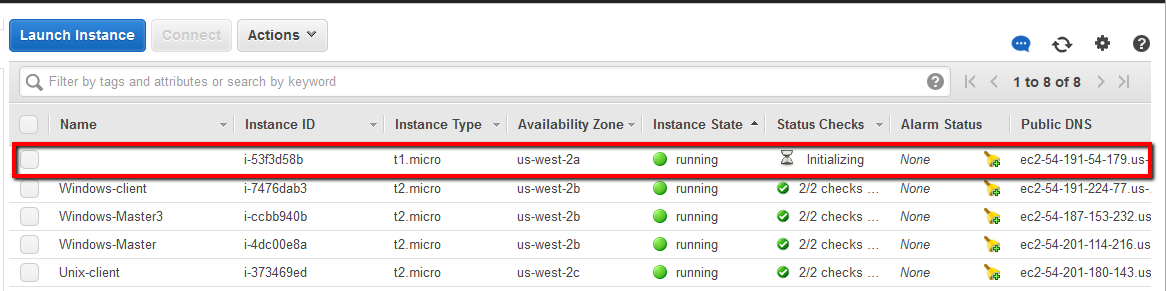
Check the Status of your AWS Machines
Your windows Master machine should already be running. The Linux machine may or may not be running. The Linux machine is run up automatically by Jenkins so it’s fine if it’s not running right at this moment. Whatever the state of the linux machine you should see the Windows machines status in the AWS console as follows:
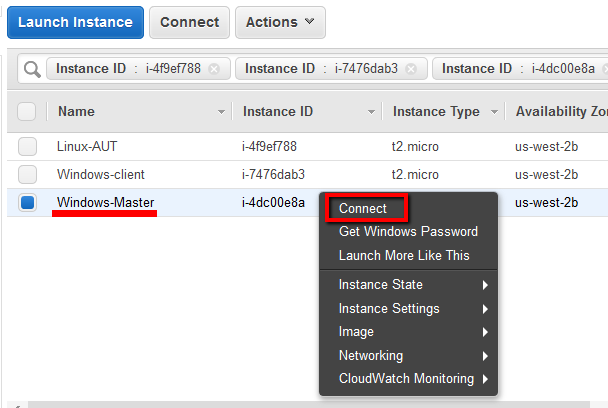
Open an RDP Terminal Session on the Windows Master Machine
With these windows machines running you’ll need to open an RDP session on the Windows Master machine. This is where we’ll configure Jenkins.
Then enter the password (you may need your .pem private key file to Decrypt the password if you’ve forgotten it) to open up the desktop session.
Start the Linux Client Machine
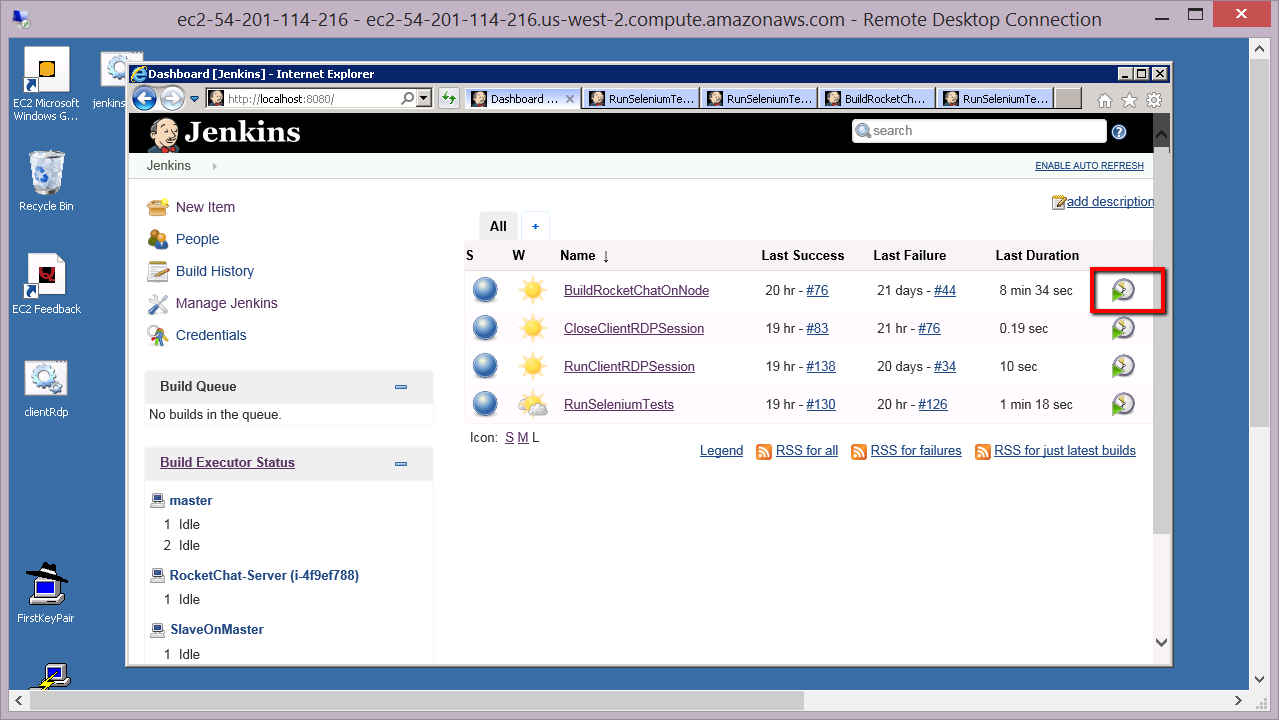
If the Linux machine isn’t running with the AUT installed then we need to start it. We can get Jenkins to do this for us. Once you have an RDP session open to your Windows Master machine you should have the Jenkins home pages displayed. If not open a browser on this machine and go to this URL:
> http://localhost:8080/
From here you can start the ‘BuildRocketChatOnNode’ job and start up the AUT.
Once RocketChat is up and running we’ll need to know the host name that Amazon has given our new Linux instance. We save this in our ‘publicHostname.txt’ file that is archived as part of our build job. So if you go to this directory using Explorer
C:\Program Files (x86)\Jenkins\jobs\BuildRocketChatOnNode\builds\lastSuccessfulBuild\archive
You should find this publicHostname.txt file…
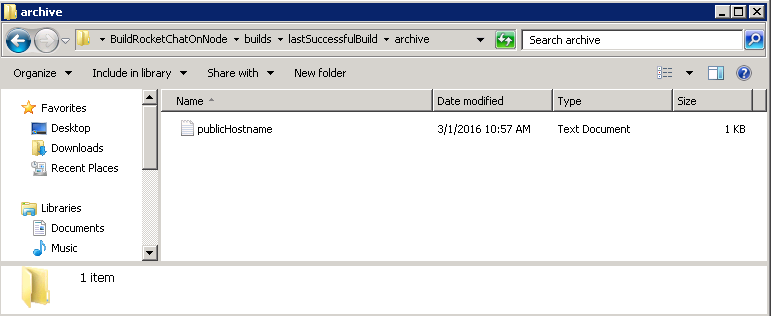
Open this with notepad and make a note of the hostname. We’ll need this while we configure our performance tests.
At this point you should have…
- An RDP session open to your Windows Master machine
- Your Linux Ubuntu machine running with Rocket Chat installed
From here we’ll setup our Windows Master machine and install/configure JMeter on the Master machine.
Part 1: Install JMeter
We’re going to use our existing Windows Master machine for this. We’ll install JMeter on this machine so that we can develop our performance tests on this Master test machine. We just need to open the RDP session, download JMeter and install it.
On the
Windows Master machine follow these steps:
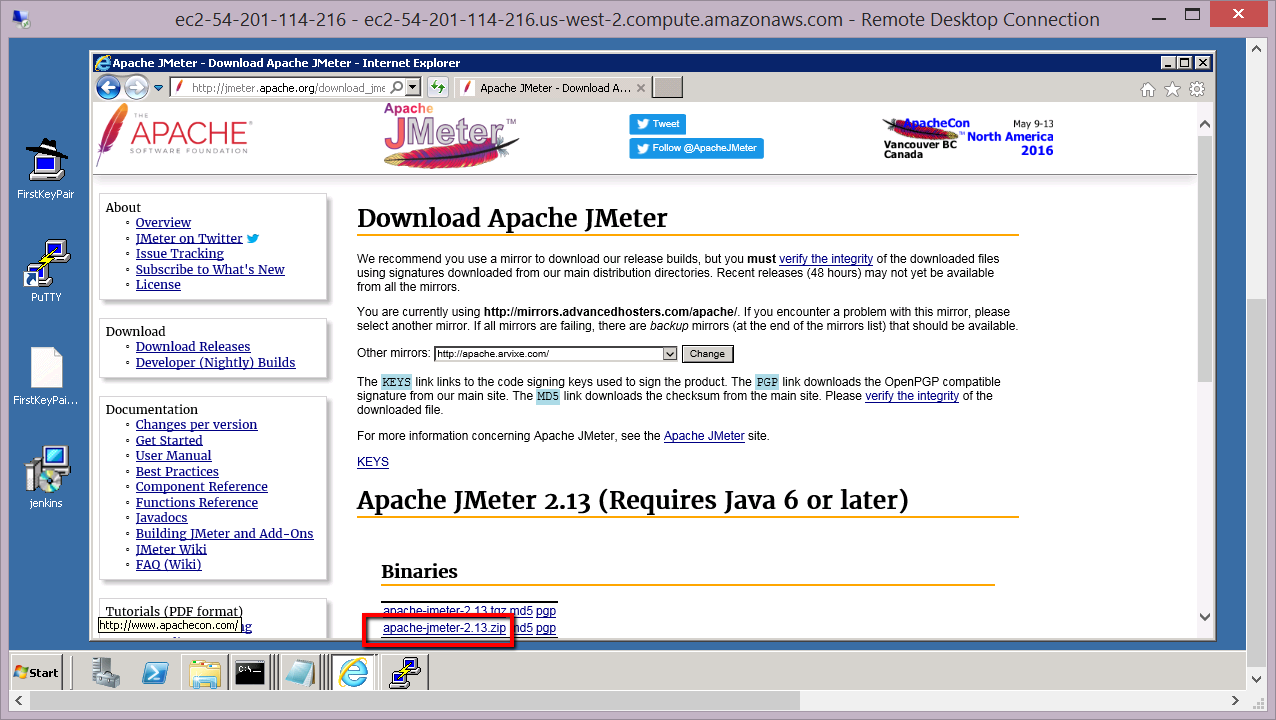
- Open a browser
- Enter the following address:
http://jmeter.apache.org/download_jmeter.cgi
- Download the Apache JMeter Zip’ package
- Open the download folder and extract the JMeter folder from the zip file…
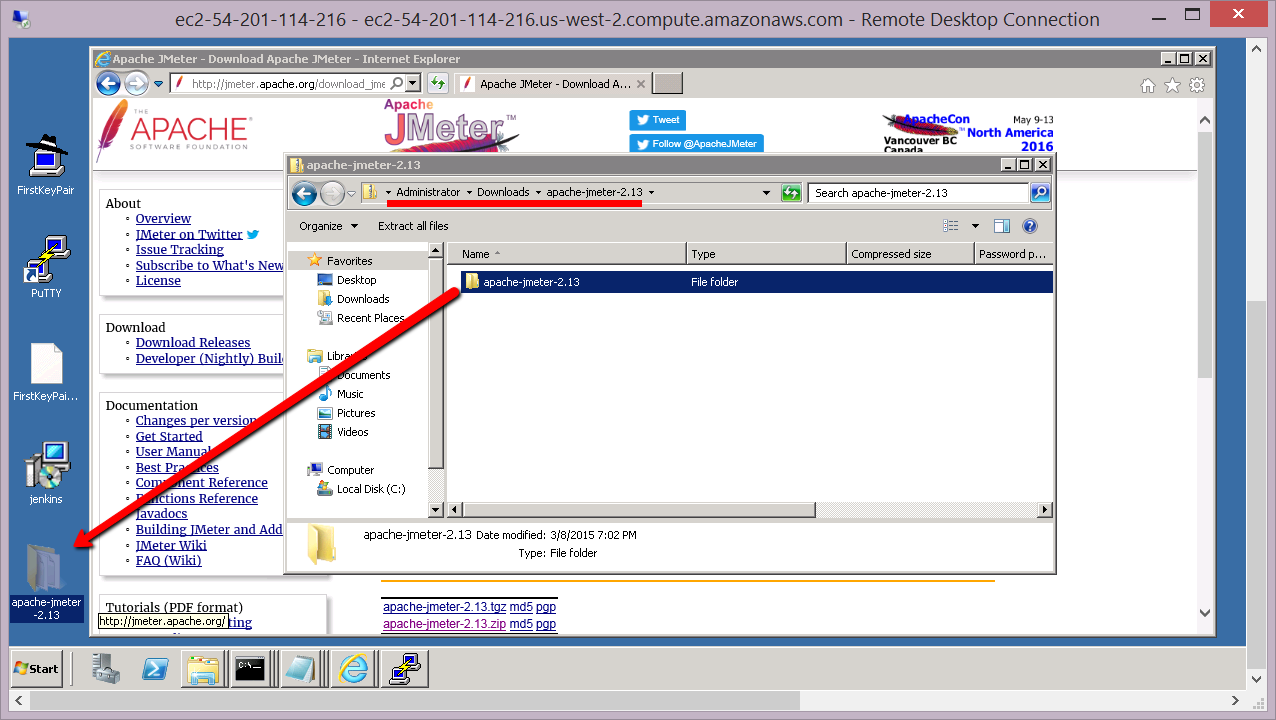
- Open the folder that contains JMeter.
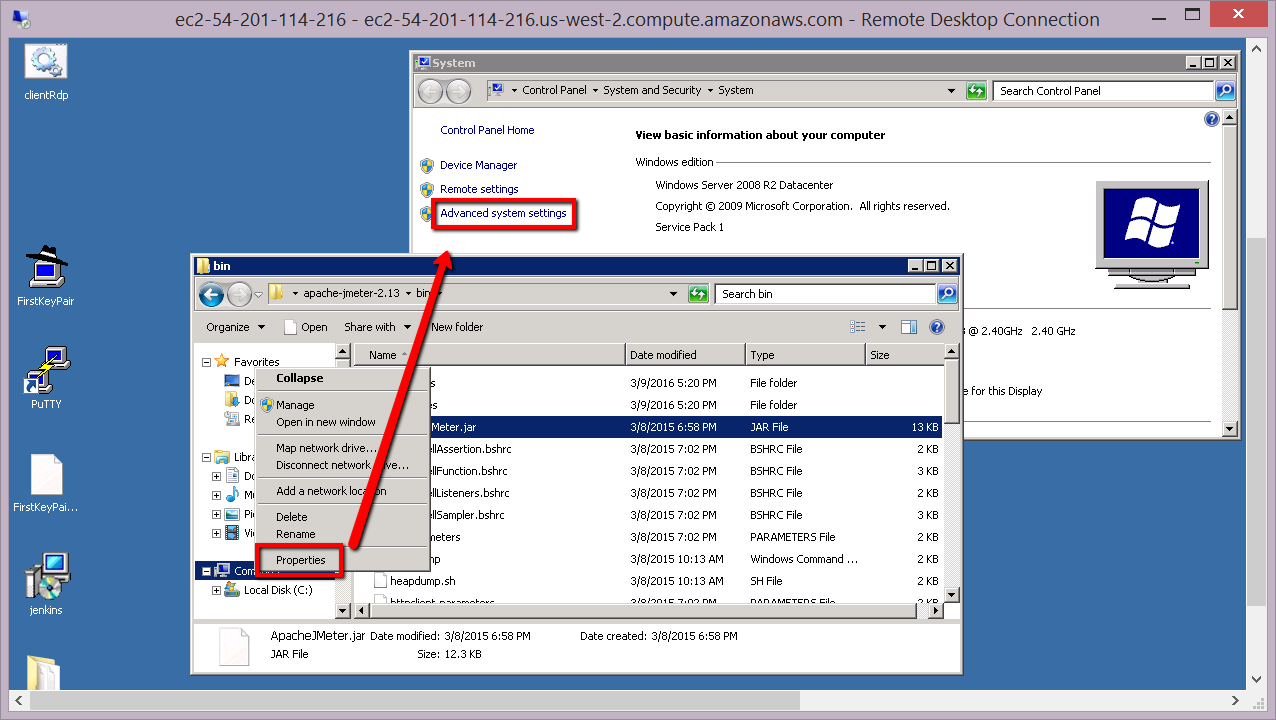
Before you can run JMeter we need to configure the PATH environment variable so that it contains the path to our Java install.
- Configure the environment variable by ‘right clicking on Computer’. Then selecting ‘Properties’ followed by ‘Advanced system settings’
- In the ‘advanced system settings’ click on ‘Environment Variables’ and find the ‘Path’ environment variable to edit:
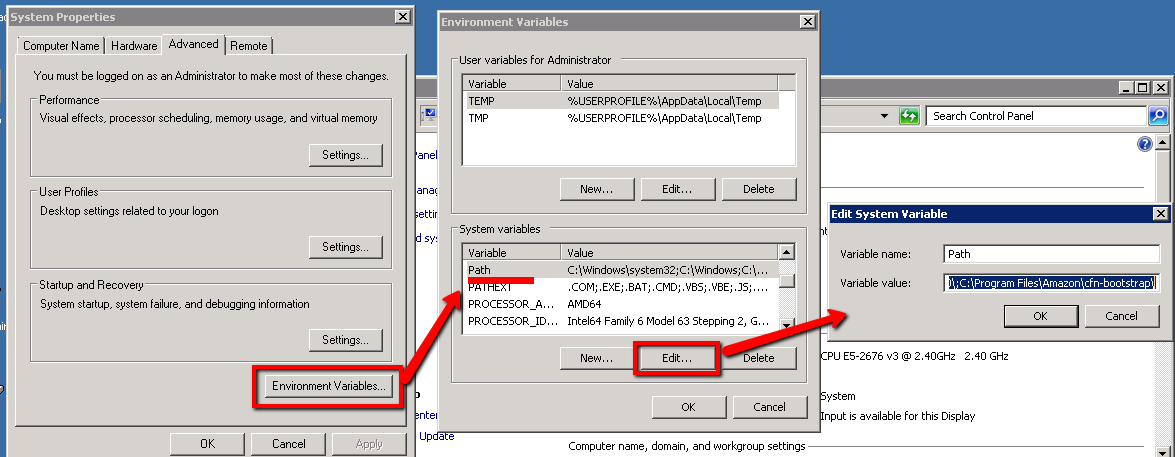
- At the end of the ‘Path’ environment variable add this text at the end:
;C:\Program Files (x86)\Jenkins\jre\bin\
Note the ‘semi-colon’ at the start of the text and the ‘’ at the end. When you’ve finished the full path should be something like this:
> %SystemRoot%\system32;%SystemRoot%;%SystemRoot%\System32\Wbem;%systemroot%\System32\WindowsPowerShell\v1.0\;%systemroot%\System32\WindowsPowerShell\v1.0\;C:\Program Files\Amazon\cfn-bootstrap\;C:\Program Files (x86)\Jenkins\jre\bin\
Save this. If you want to check this works then open a command prompt and just type ‘java -version’. This should show you the version of Java we have installed.
- From here you should be able to run JMeter by clicking on the ‘JMeter Batch file’ in explorer:
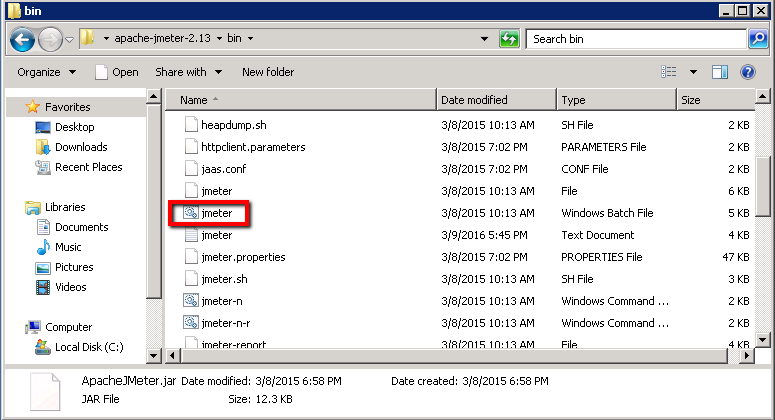
You can create a desktop short cut to this batch file if you want to. This will make your life a little easier later on.
- At this point you should be presented with the JMeter GUI.
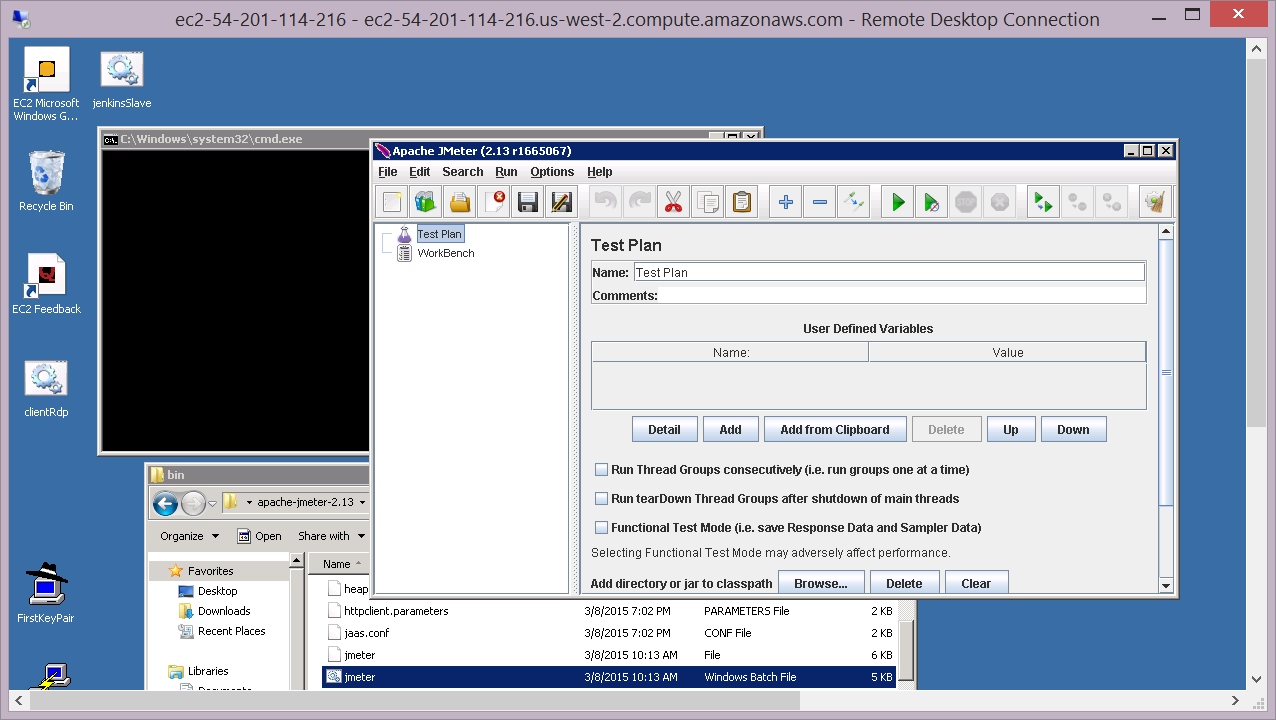
Now we’re ready to start configuring our performance tests.
Part 2: Initial Configuration of JMeter
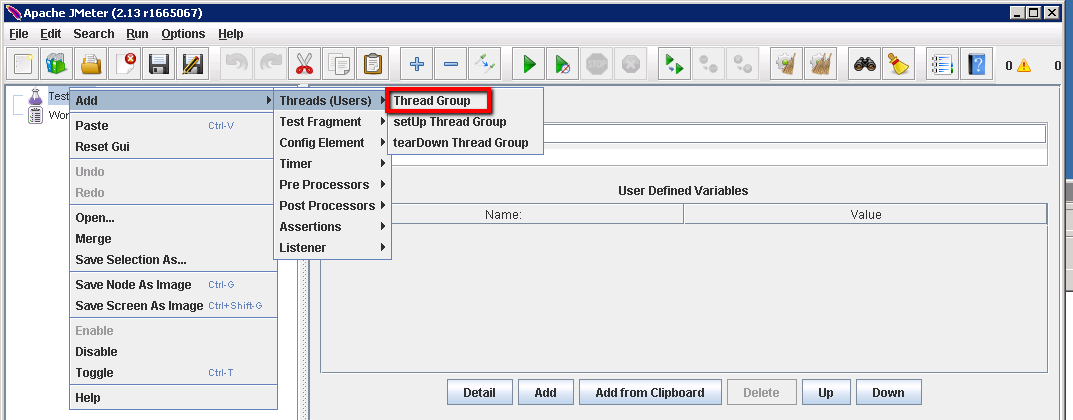
Initially we just need to setup JMeter and check that we can send a single request and get a response. We’ll configure a Thread Group (users) against the Rocket Chat /api/version end point. Once we can get a response from this end point we’ll move on to configure a more realistic set of load scenarios.
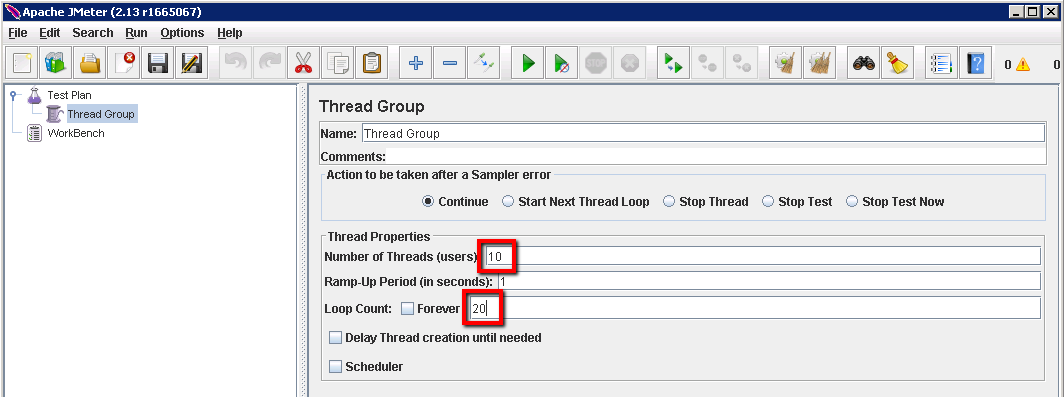
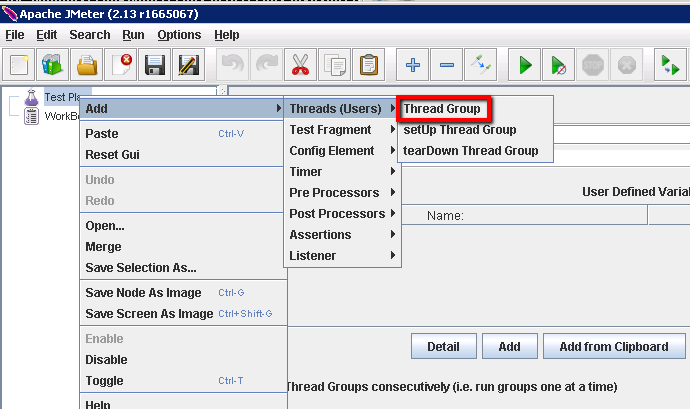
- Right click on ‘Test Plan’ and select ‘Thread Group’ so that we can define the number of users we need to simulate
- Update these settings for the Thread Group:
Number of Threads (users): 10
Loop Count: 20
This way we’ll simulate 10 user and repeat our test 20 times.
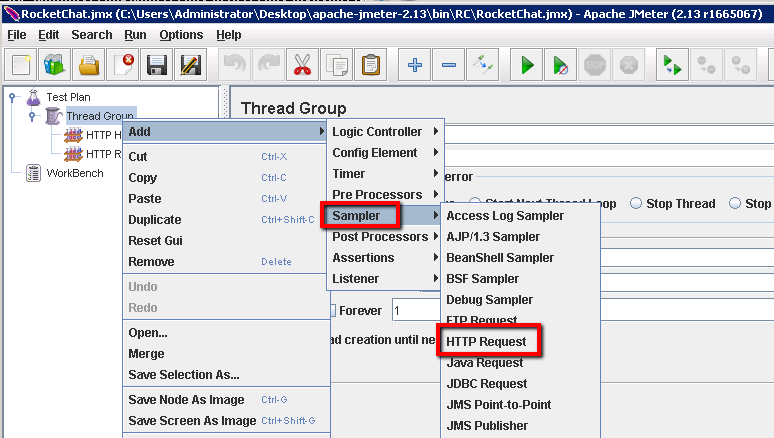
- Right click on the ‘Thread Group’ node and select ‘Add’ followed by ‘Sampler’. Then select HTTP Request:
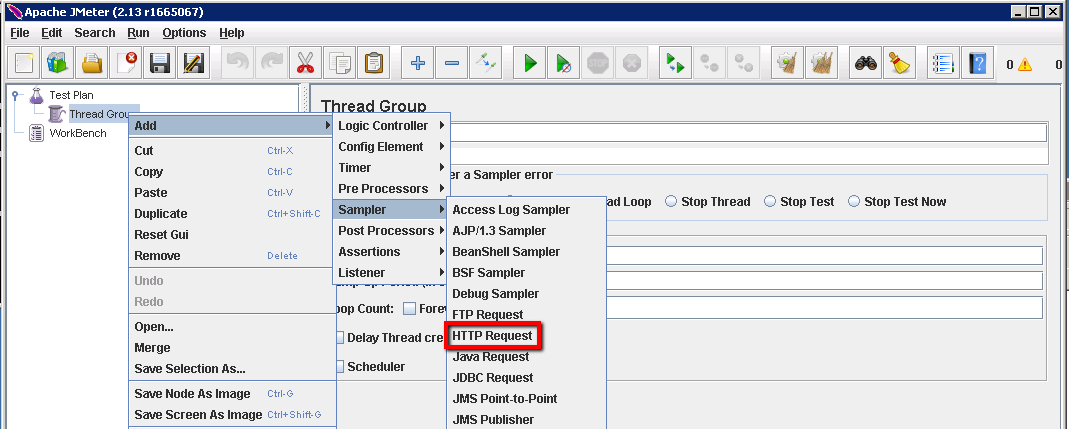
This will allows us to create a REST API request that uses the Http protocol (similar to the functional tests we’ve already created with SoapUI).
- On the ‘HTTP Request’ pane we need to specify the details for the request. Update the following:
Server Name or IP: <host name for Rocket Chat>*
Port Number: 3000
Method: GET
Path: /api/version
this is the host name we obtained from the publicHostname.txt file when we completed the Prerequisite tasks at the start of this module. You should not put the ‘http://’ at the start of this field.
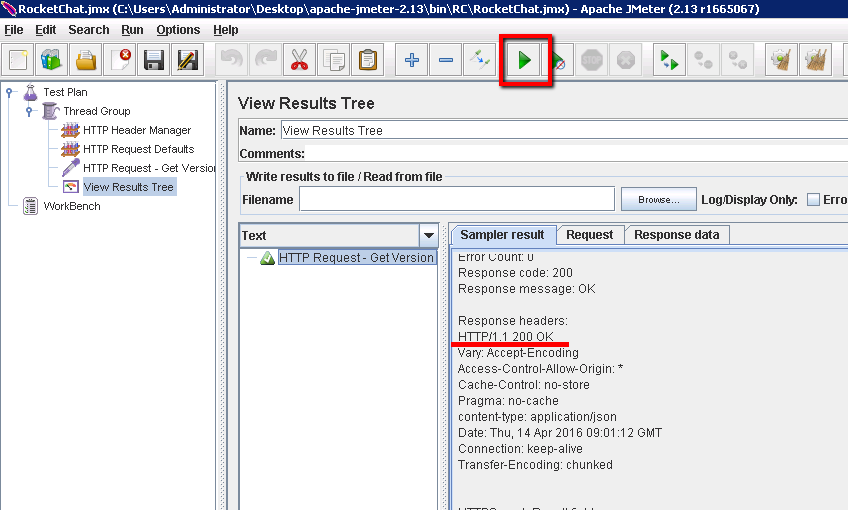
- On the Test Plan create a ‘View Results Tree’ listener:
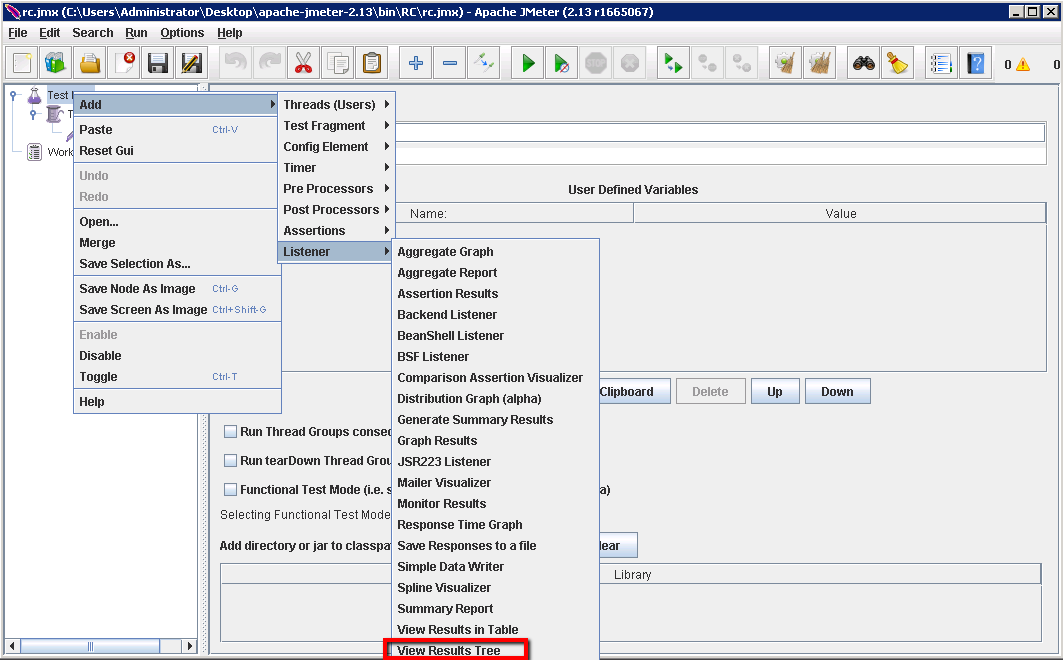
You can leave all the defaults set here so that the Result Tree settings look like this
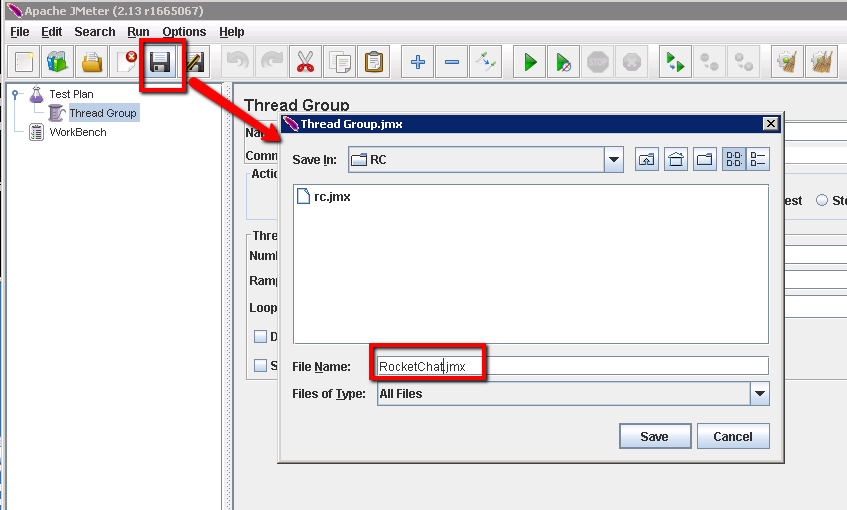
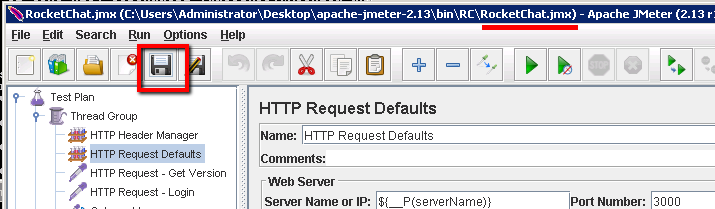
- Save the Test Plan at this point (click on file and select ‘Save Test Plan as’)
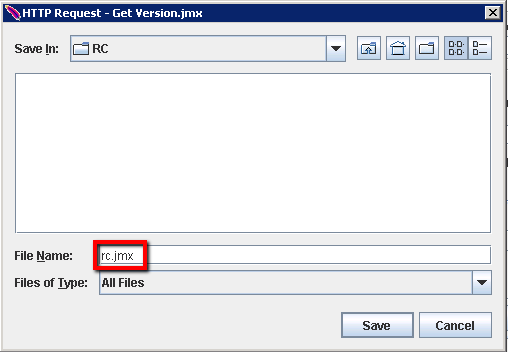
Save the test plan as ‘RocketChat.jmx’.
- Click on ‘Start’ and check you get valid responses
Now that we have a successful connection, with requests and responses, we can configure some more scenarios that will give us a more relaistic load.
Part 3: Configuring Our Performance Tests
In SoapUI we created a test case that logged in and then passed the userId and authToken to the subsequent test cases (API calls). We need to create a similar setup in JMeter. The main difference this time round being that we’ll have to simulate multiple users and track multiple userID and authToken sessions. We do this in JMeter by configuring Threads, where a single thread represents a single user.
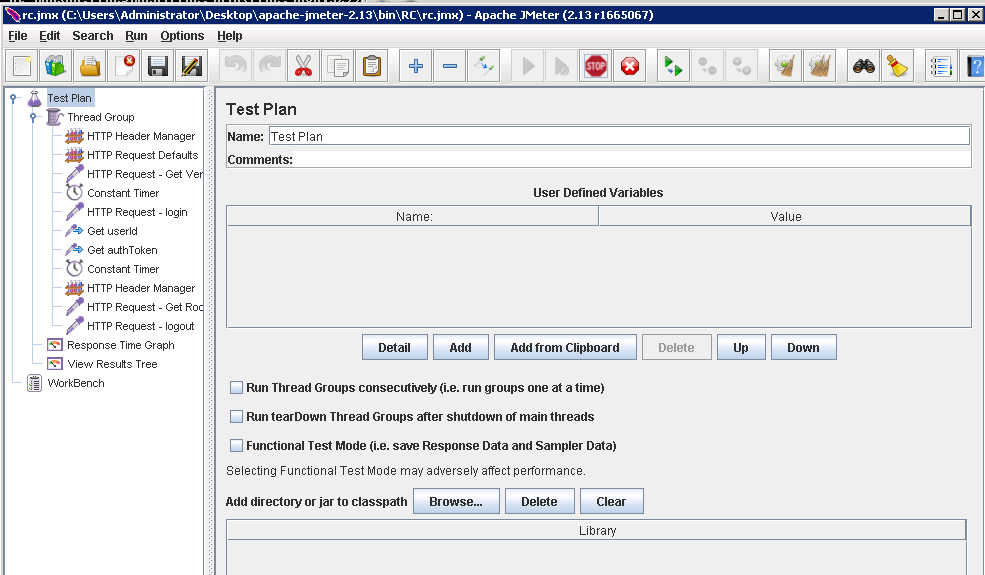
- First we need to create a new test plan in JMeter
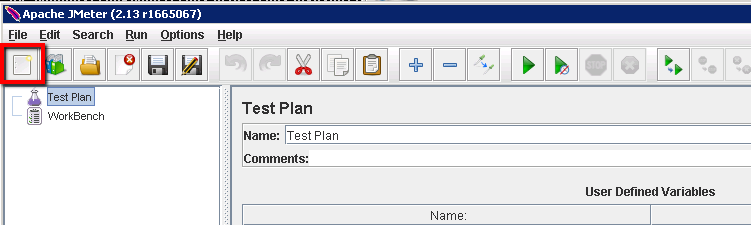
We can leave all the default settings for the test plan as they are, although you can change the name if you need to.
- Next we can add a new thread group. Right click on the test plan and add the ‘Thread Group’…
Again we can leave all the default settings for this thread group (e.g. 1 user and loop count of 1)
- Probably a good point to save this project, so click on the save button and save this as ‘RocketChat.jmx’
- Now we need to start building out the Http requests that we’ll need to send to the Rocket Chat API in order to load test it. The spec for the Rocket Chat API can be found here
https://rocket.chat/docs/master/developer-guides-4-rest-api
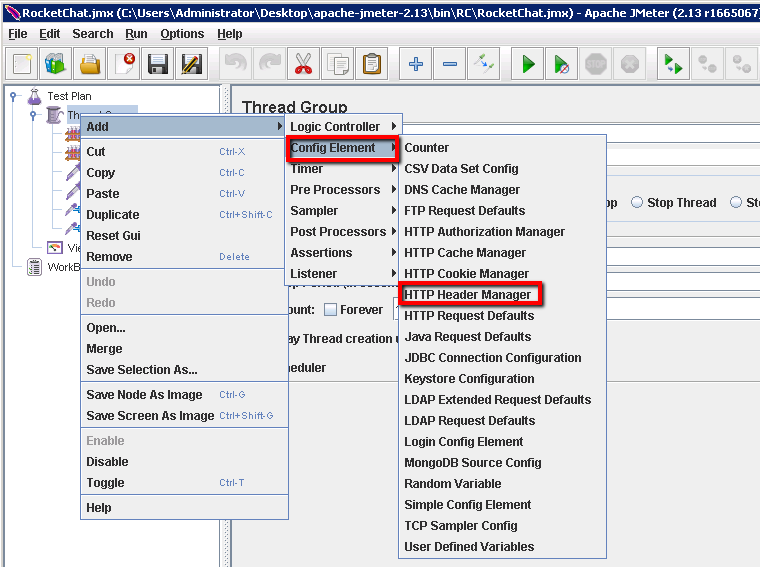
First then we’ll setup a default HTTP Header by adding an ‘HTTP Header Manager’ node.
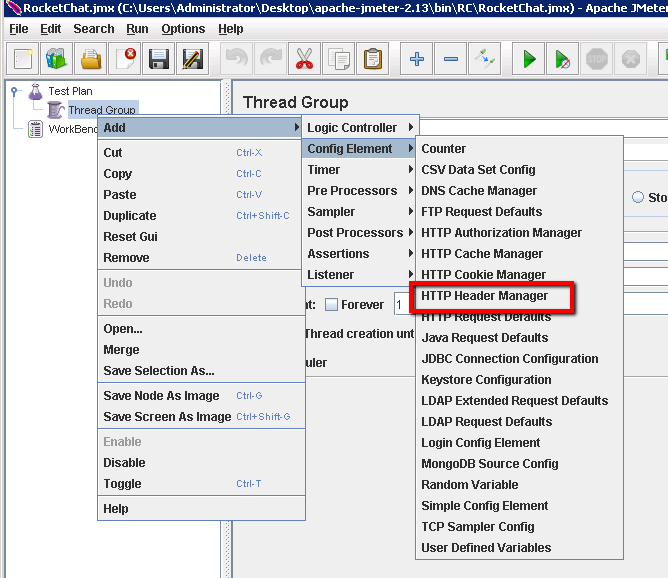
And for our Rocket Chat request to work we’ll need to add one Header record as follows:
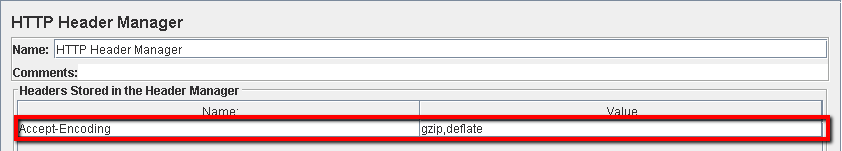
So add the following:
Name: Accept-Encoding
Value: gzip, deflate
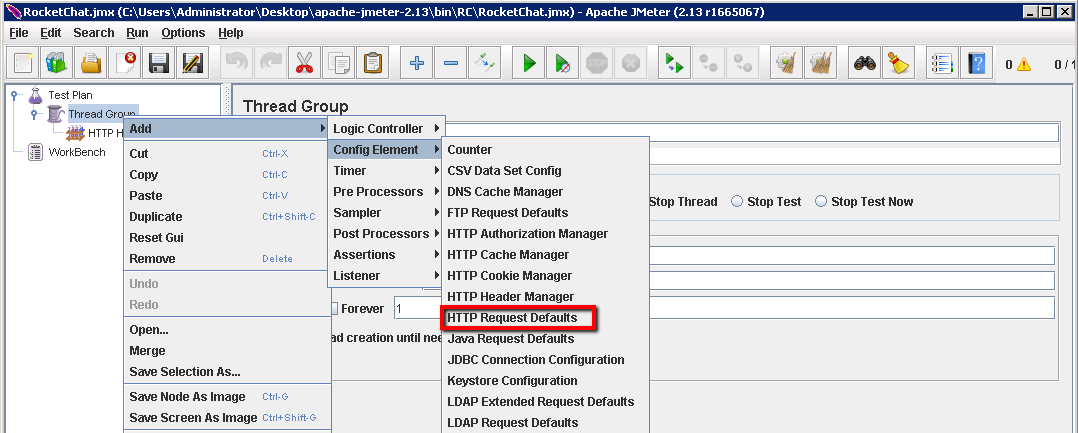
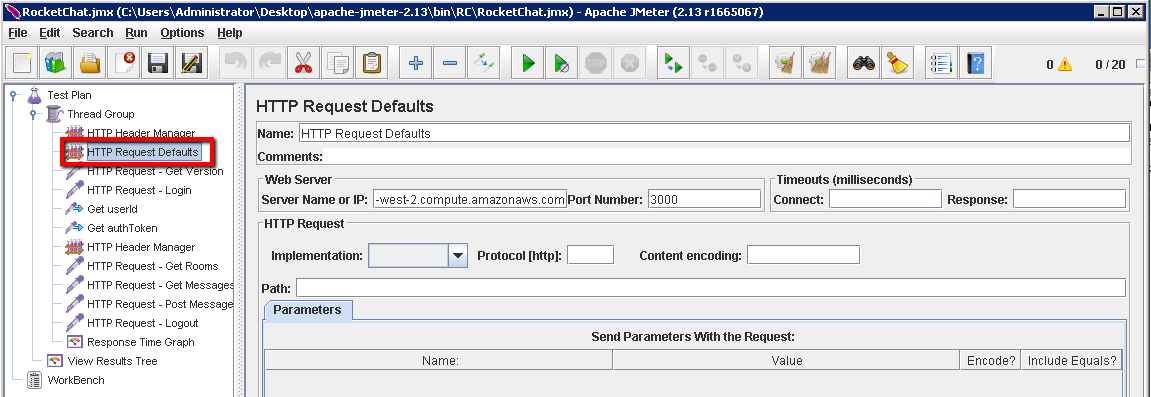
- Then we need to add an ‘HTTP Request Defaults’ record. This will allow us to define the default URL and end point for all the subsequent Http requests we define.
And define the settings for this as follows:
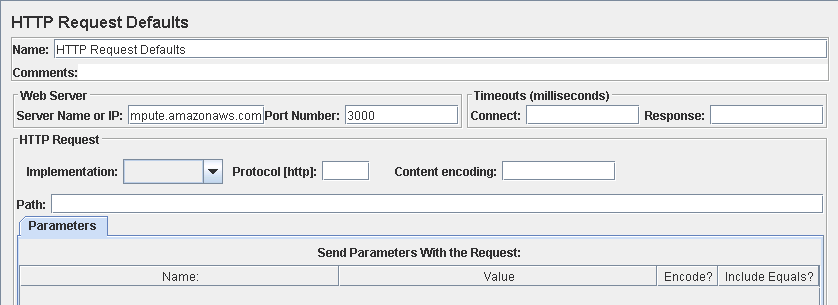
Where we have set these two fields:
Server Name: <your AWS Rocket Chat host name>
Port Number: 3000
It’s these values that will be passed on to all subsequent requests as the defaults. Just saves us having to define the same values in all the other requests.
- So now we’re ready to actually send our first Http request the Rocket Chat Api. So we’ll an ‘HTTP Request’:
All we need to configure here is the End point path and method (and provide a more meaningful name)
Name: HTTP Request – Get Version
Path: /api/version
Method: GET
Like this…
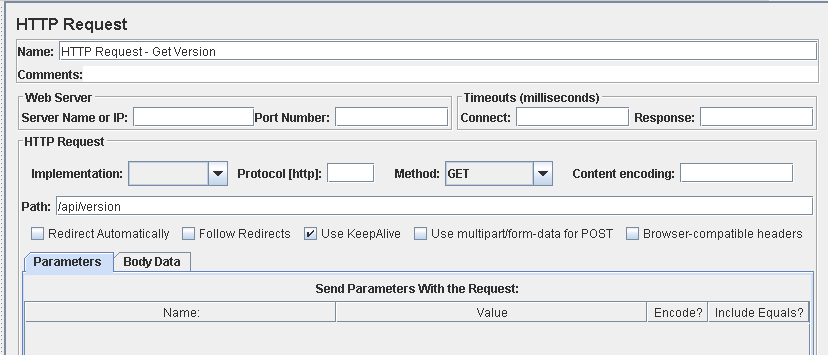
All this is going to do is get the version of Rocket Chat that we’re running. It does check we’ve configured everything correctly though. We’ll need to add a listener that tracks the requests and responses and then we’ll be able to run this.
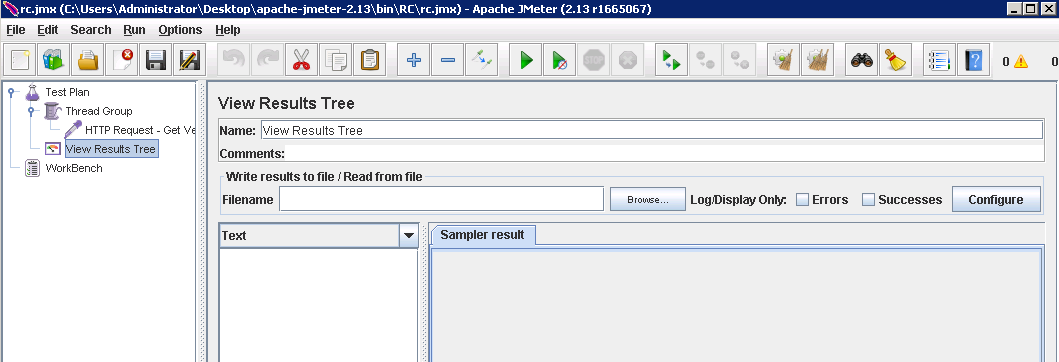
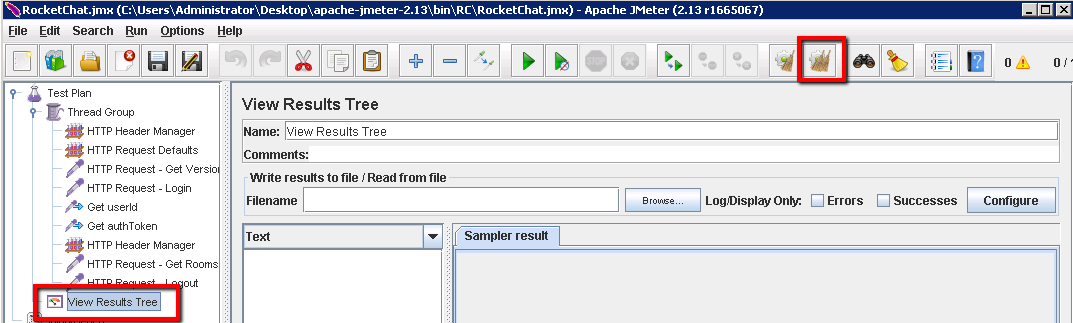
- Add a ‘View Results Tree’ listener as follows:
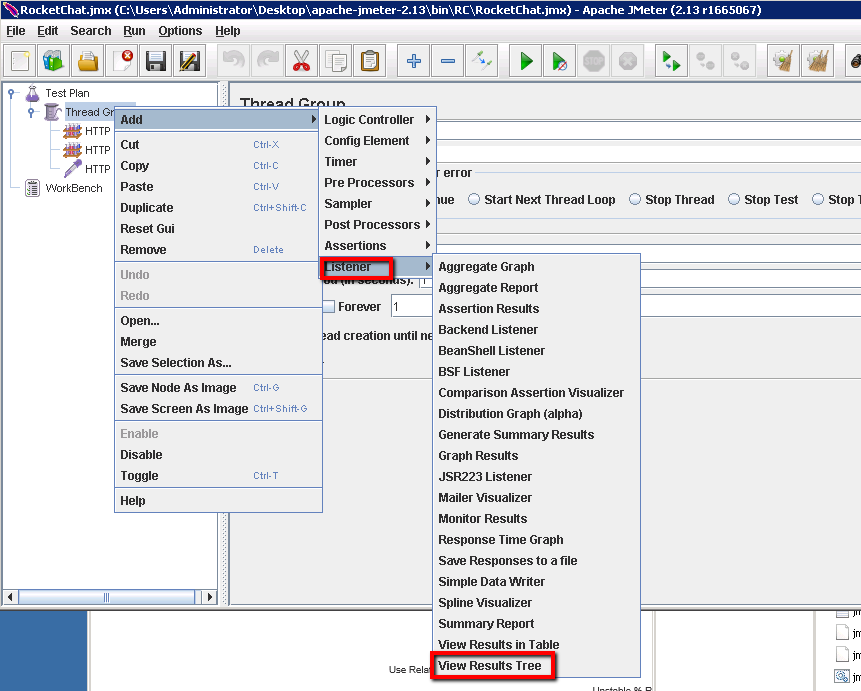
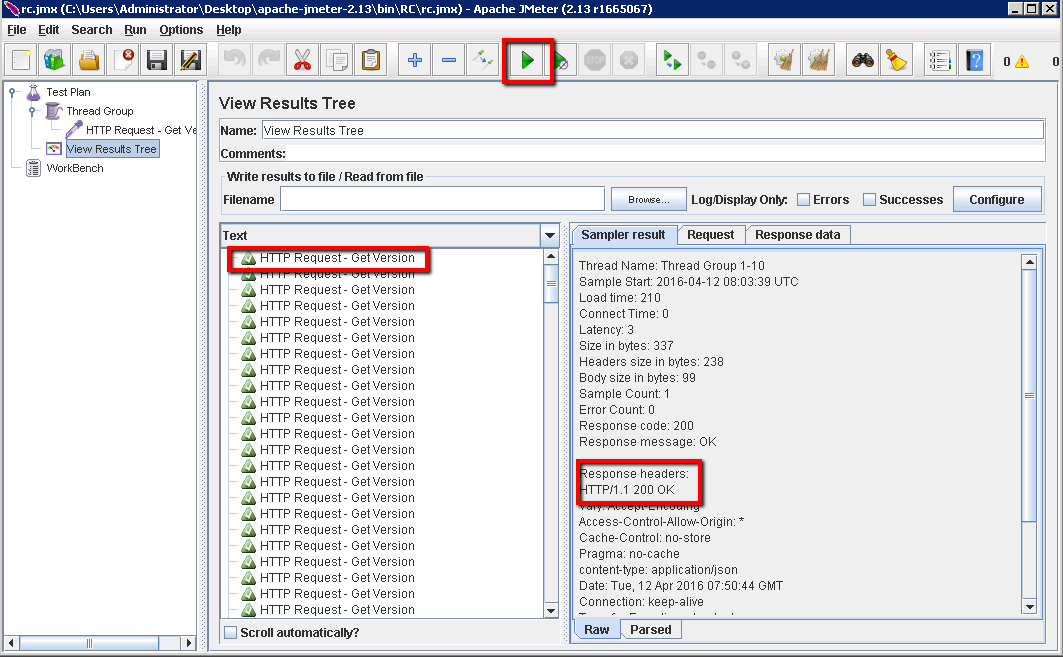
You don’t need to configure anything in this, but once it’s in place we can check our script so far. Just click on the run button and look at the ‘sampler results’
At this point we just need configure a few more requests and make sure we have the userId and authToken passed to those requests.
Key to the other requests is the login. When we login we get a userId and AuthToken returned in the response. The userId and AuthToken need to be used in the following requests. So we’ll login and store the userID and AuthToken as variables for the other requests. For this we need to setup the login request followed by two post processor ‘Regualr Expressin Extractors’
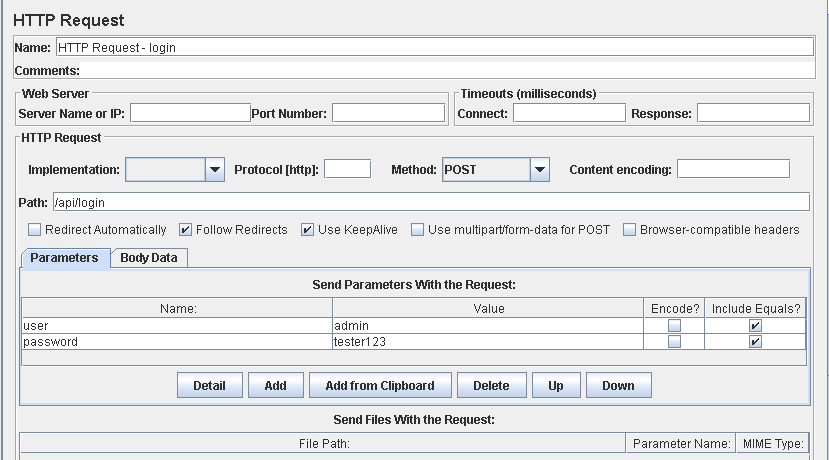
- Add a another HTTP Request (Thread group -> Add -> Sampler -> Http Request) and configure it as follows:
Name: HTTP Request – login
Path: /api/login
Method: POST
user: admin
password: tester123
Making sure you add these user and password login parameters:
The response when we run this request will include this json content:
{
“status”: “success”,
“data”: {
“authToken”: “uzdJZQNrtCYdGcnBL8kfKOxRNe6EmBArmzcTZKTghj0”,
“userId”: “6eJ6cZG6azfLj24QX”
}
}
So in our JMeter configuration we now need to pass this and capture the authToken and userId values.
- Now we’ll add TWO post processors that will use regular expressions to extract the values we need:
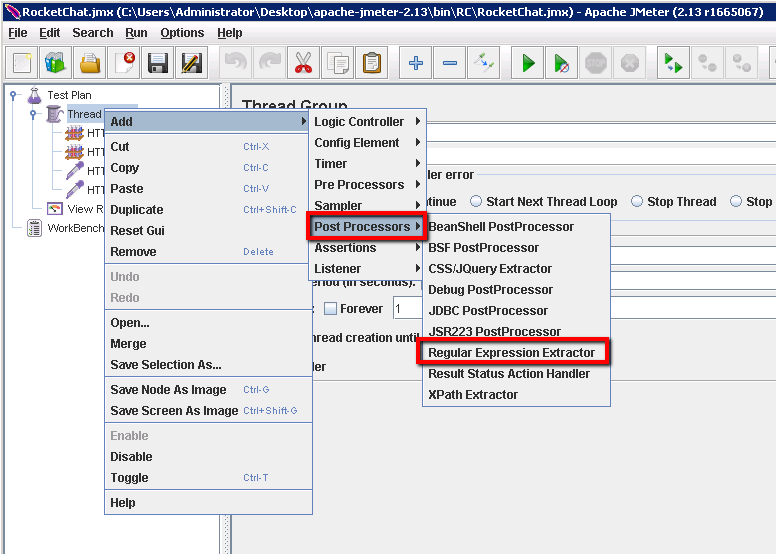
Adding two of them as follows:
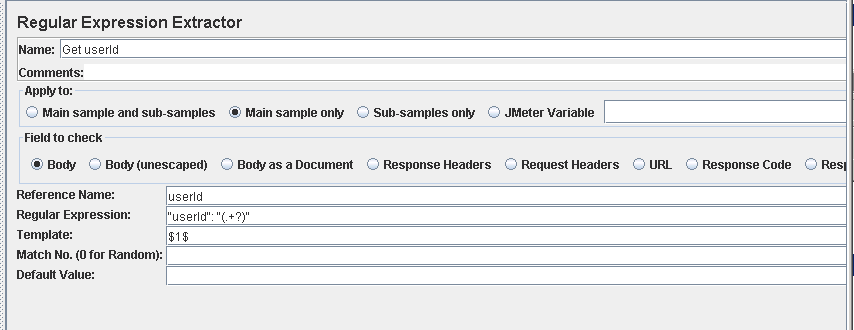
Name: Get userId
Apply to: Main sample only
Field to check: Body
Reference Name: userId *
Regular Expression: “userId”: “(.+?)”
Template: $1$
And …
Name: Get authToken
Apply to: Main sample only
Field to check: Body
Reference Name: authToken *
Regular Expression: “authToken”: “(.+?)”
Template: $1$
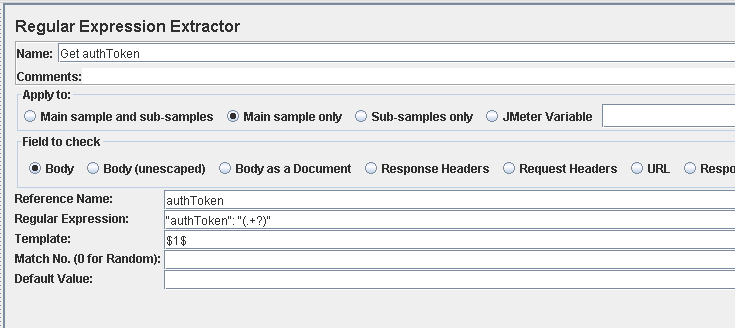
- it’s the Reference Name that is the variable name that stores the values used in the following Http requests.
Both of these values need to be passed in the header for other Http requests that require authentication. So we’ll add a new ‘HTTP Header Manager’ and add these userID and authToken values in there.
- Add a 2nd ‘HTTP Header Manager’ config element
Where this is configured as follows:
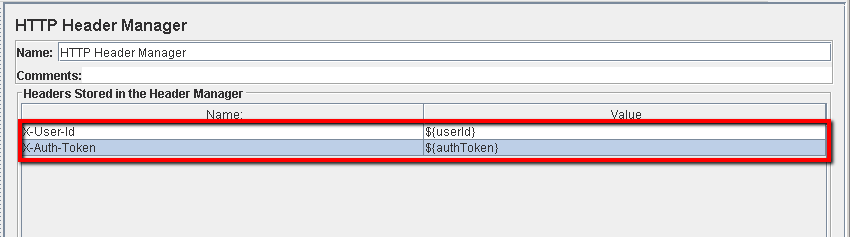
X-User-Id: ${userId}
X-Auth-Token: ${authToken}
The ${} nomenclature is used to insert the variables that we’re set in the regular expressions extraction.
Now we have the authentication details in the header we can call the Get Rooms and Logout HTTP requests.
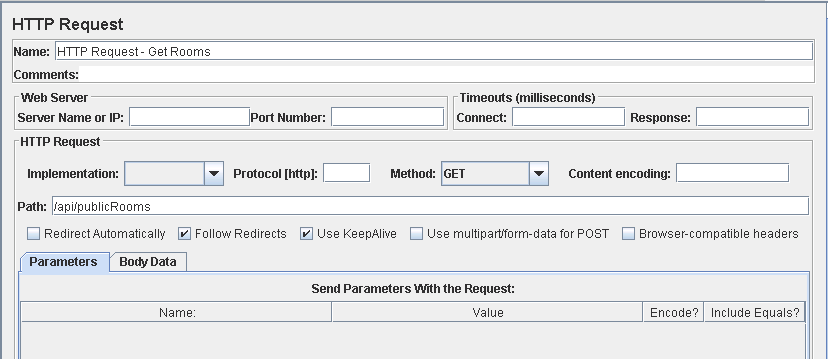
- Add the ‘Get Public Rooms’ HTTP request (Thread group -> Add -> Sampler -> Http Request) and configure this as follows:
Name: HTTP Request – Get Rooms
Path: /api/publicRooms
Method: GET
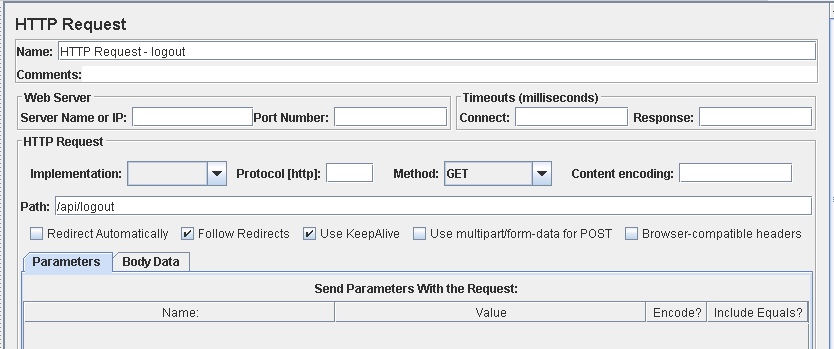
- Add the ‘logout’ HTTP request (Thread group -> Add -> Sampler -> Http Request) and configure this as follows:
Name: HTTP Request – Logout
Path: /api/logout
Method: GET
Now let’s check that end to end
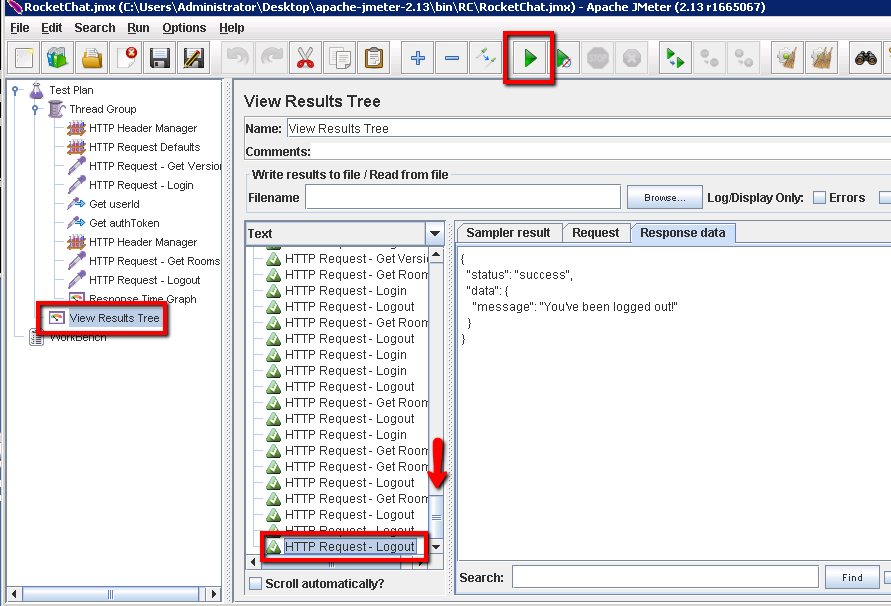
- Click on the ‘View Results Tree’ and clear the previous results
Then run this thread group (that only simulates 1 user at the moment). If you click on the Get Rooms request and look at the response data you should see something like this:
Which basically proves that we’ve picked up the correct authentication data from the Login request and used it in the headers for subsequent requests successfully.
We’ll add one more Listener to give us a graph of our results and increase the number of users. With that we’re pretty much done.
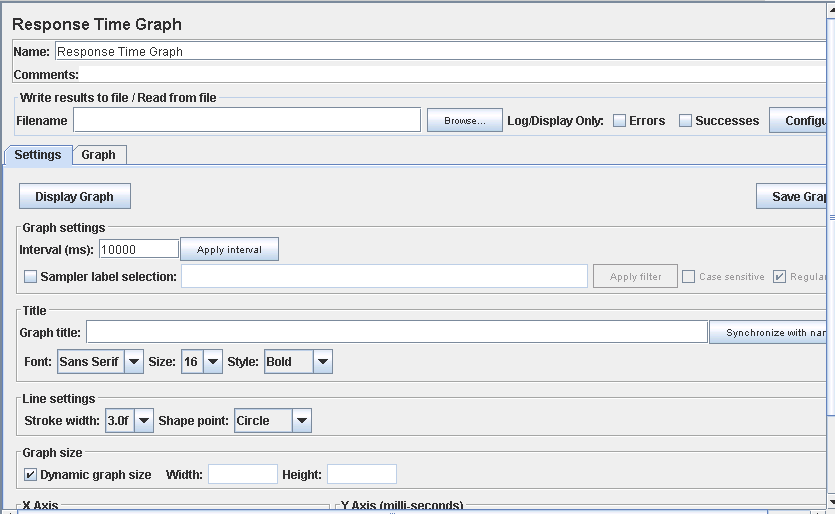
- Add a response time graph
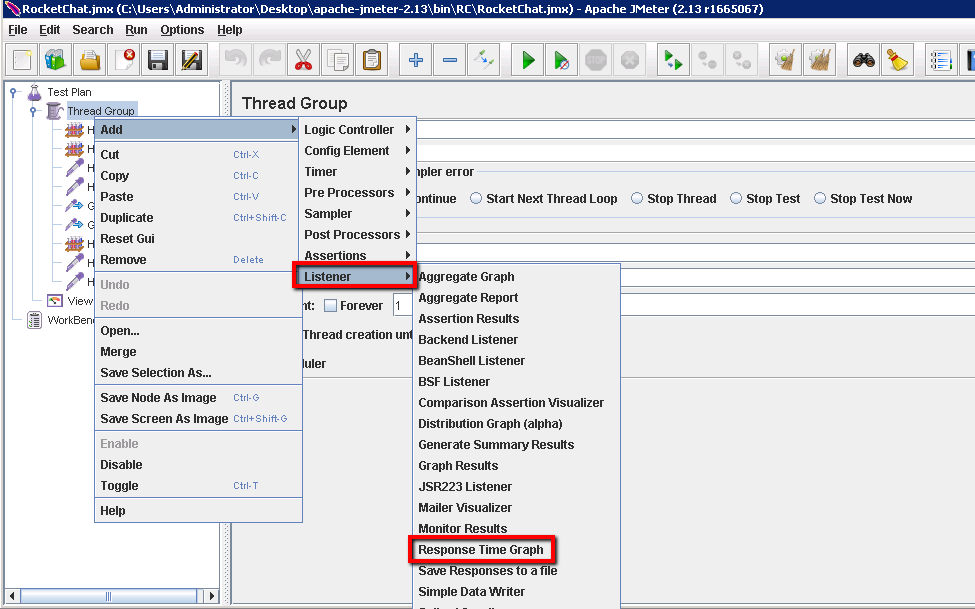
And stick with the defaults to that this graph is configured as follows:
- Increase the number of simulated users by altering the thread group settings
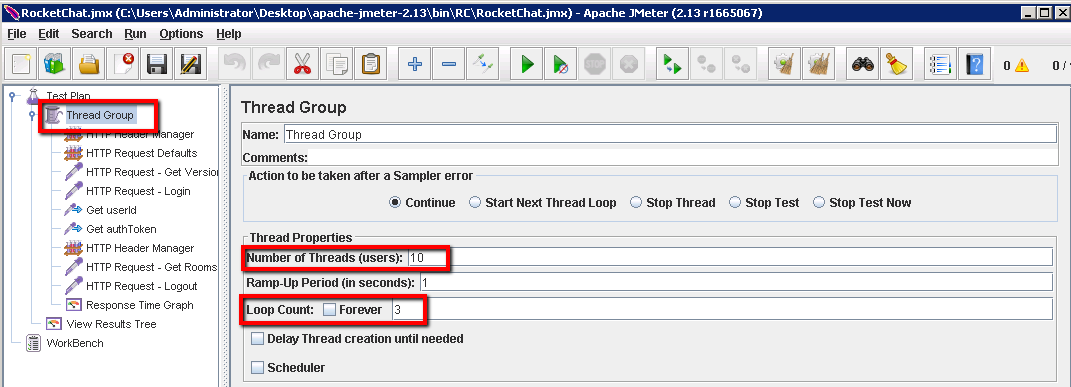
So we’ll change just these two values:
Number of Threads (users): 20
Loop count: 10
With these settings we’ll create 20 simulated users and each will go through our set of requests 10 times. So effectively we’ll run the scenario we’ve created 200 times.
At this point your JMeter Test Plan structure should look something like this…
(You can add the ‘Constant Timers’ in to your test plan if you like just to make things a little more realistic.)
- Run the simulated load test by clicking on the ‘View Results Tree’ and clear the previous results
Then we can run the load test by clicking on the run button and viewing the results:
And if we click on the ‘Response Time Graph’ we should be able to see what the response times for all of our different requests look like:
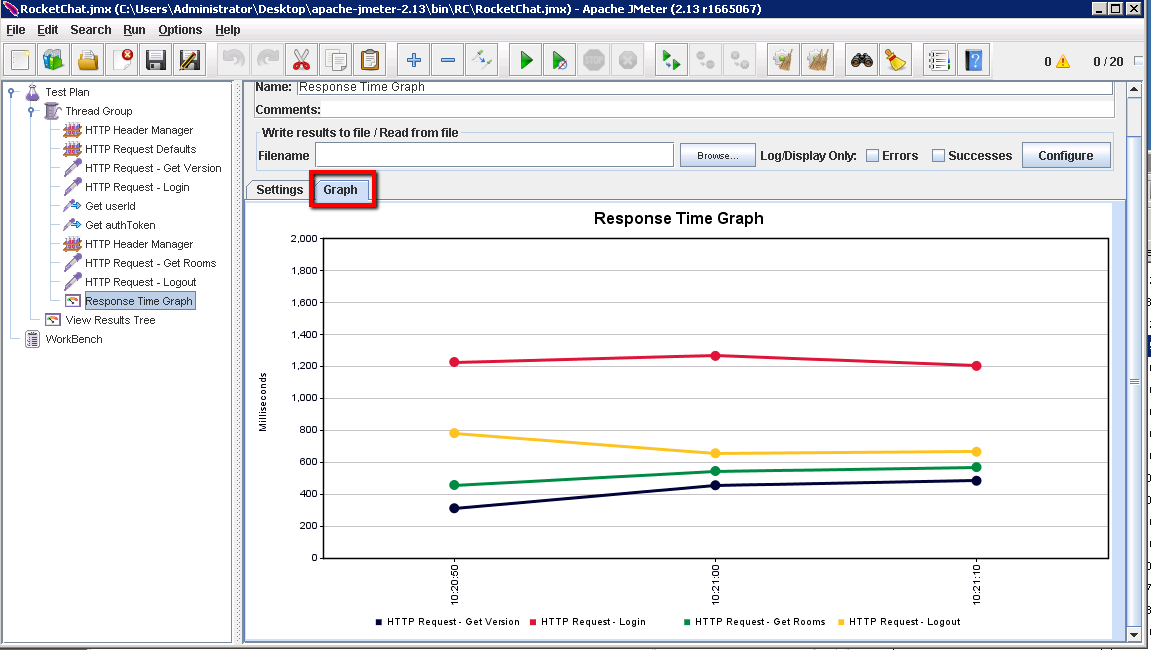
Nothing too much to worry about in those results but they will form the basis of our trending across multiple builds/test-runs as we plug this into Jenkins. And that the next bit. Tying all of this into Jenkins so that it’s run automatically and the results are pulled back for reporting in Jenkins too.
Probably not a bad idea to save your JMeter project at this point too.
Part 4: Configuring our Linux Performance Test Server
We’ve developed our tests using the JMeter GUI on a windows machine. That’s fine and makes our life easier on the development side of things. However, to deliver our distributed and scalable performance capacity we’ll deploy these tests on an AWS Linux instance that’s run up automatically.
Normally we’d have an SVN or Git source code repository that we’d check our tests into (all our Selenium, SoapUI and JMeter). During development of the tests we’d check our JMeter tests in to this source code repository from the Windows machine. At excution time we’d have our Linux machine check out the latest version of these tests.
For the purpose of this course though we’re just going to take our JMeter configuration file, the RocketChat.jmx file, store this on our Windows Master machine. Our Jenkins on our Windows master machine can then deploy this JMeter config file to our Linux performance test server when we start the test.
First off then lest configure our Linux machine. Similar Jenkins setup to the Rocket Chat Linux server we setup at the start of this course. We’ll start this Linux machine on demand and shut it down automatically when it’s not needed.
- On our Windows master machine add the new AMI in the Jenkins configuration section:
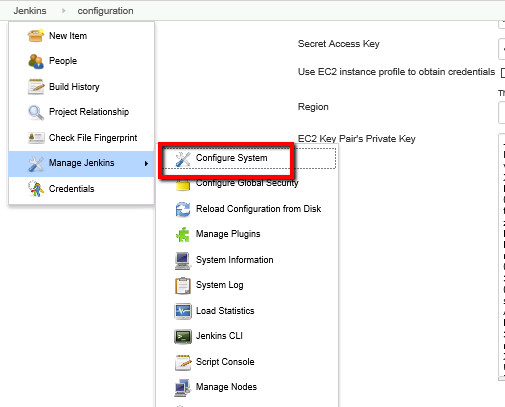
Which should take you to this Jenkins URL:
> http://localhost:8080/configure
We already have our Amazon EC2 service configured in Jenkins. And under this configuation we have two servers configured already:
i. RocketChat-Server (AUT running on Linux)
ii. Windows-Client (Selenium windows server)
We’re going to add a third now (very similar to the RocketChat-Server)
iii. Perfromance-Client (JMeter Linux server)
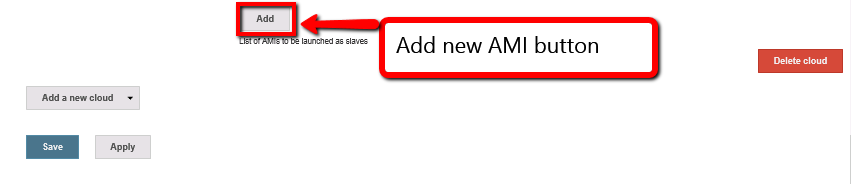
Click the ‘Add (List of AMIs to be launched as slaves)’ button right at the bottom of the page:
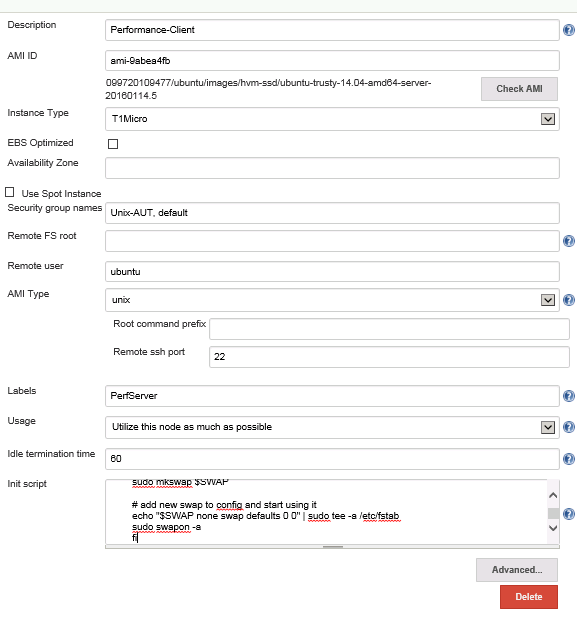
- Configure this new AMI with the following parameters:
Description: Performance-Client
AMI ID: ami-9abea4fc *1
Instance Type: T2Micro
Security group names: Unix-AUT, default
Remote user: ubuntu
AMI type: unix
Remote ssh port: 22
Labels: PerfServer *2
Usage: Utilize this node as much as possible
Idle temination time: 60 *3
Init script: <see below>
Number of executors: 1
You’ll still have to enter the ‘Init script’ as show below but every thing else can be left blank for this AMI’s settings.
*1 – note that the AMI may be different for you. This depends on which AWS regieon you’re using. Of course Amazon may just have removed this AMI and added a new one with a different AMI ID. You’ll need to search in your AWS console for something similar to “Ubuntu Server 14.04 LTS (PV),EBS General Purpose (SSD) Volume Type. ”
*2 – we’re going to user this Label (PerfServer) to force the performace job to run on this machine
*3 – setting the idle temination time to 60 minutes means that we’ll automatically shut this server down when it’s not in use. We only need this AMI running when we’re running our performance tests.
The init script we’ll want to enter is as follows.
‘’’
#!/bin/sh
# Update existing packages and install Java
export JAVA="/usr/bin/java"
if [ ! -x "$JAVA" ]; then
    sudo rm -rf /var/lib/apt/lists/
    sudo apt-get -y update
    sleep 10
    sudo apt-get install -y openjdk-7-jre ca-certificates-java tzdata-java libcups2 libcups2 libjpeg8 icedtea-7-jre-jamvm openjdk-7-jre-headless openjdk-7-jdk git npm jmeter
    sleep 5
fi

# Add Swap Space
SWAP=/mnt/swap1
if [ ! -f $SWAP ]; then
    sudo dd if=/dev/zero of=$SWAP bs=1M count=2K
    sudo chmod 600 $SWAP
    sudo mkswap $SWAP

    # add new swap to config and start using it
    echo "$SWAP none swap defaults 0 0" | sudo tee -a /etc/fstab
    sudo swapon -a
fi

‘’’
All we’re doing with this is making sure Java is correctly installed (for our Jenkins slave process), setting up our disk swap space and installing JMeter. Note that this init script is the same as our Rocket Chat server script except that we’ve added ‘jmeter’ to the list on the ‘apt-get install’ line.
At the end of this you should have something like this…
Lastly we need to configure a Tag. So click on the ‘Advanced’ button:
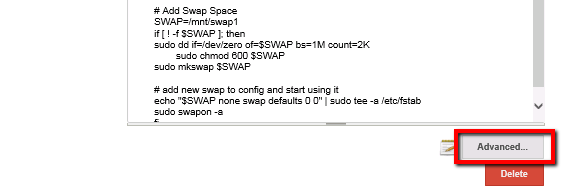
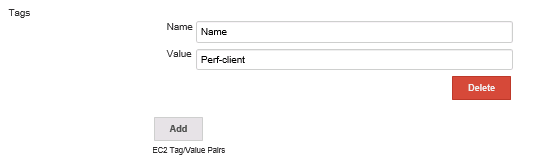
Find the ‘Tags’ section and click the ‘Add’ button:

Now enter the following values:
Name: Name
Value: Perf-client
You should have something like this:
Setting this up means that we’ll see the Name field populated automatically:
That’s nice but there’s a more important reason behind this. We have a Linux AWS instance that runs the Rocket Chat application. We also have a Linux AWS instance that will run our performance tests. Trouble is both of these machines are configured identically. If one is running in AWS and we try to start the other Jenkins thinks we already have one machine running that meets our criteria, so Jenkins won’t run the second machine up. By setting this tag Jenkins will run up two separate machines (even though they are identical configs). So it’s very important to set these tag values.
Save this and then we can check it launches okay.
- At this point we can run this performance client up and just check everything is okay the JMeter install. In Jenkins manage the nodes:
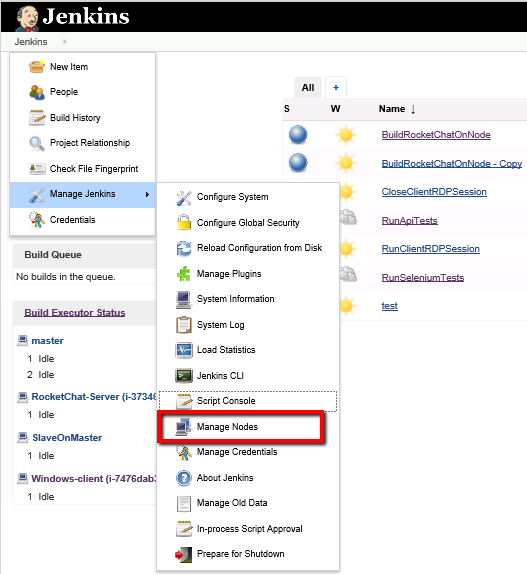
Which should take us to this Jenkins URL
http://localhost:8080/computer/
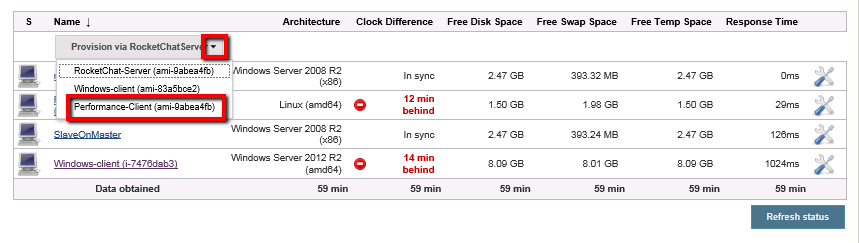
And from here we can provision the Performance client AMI
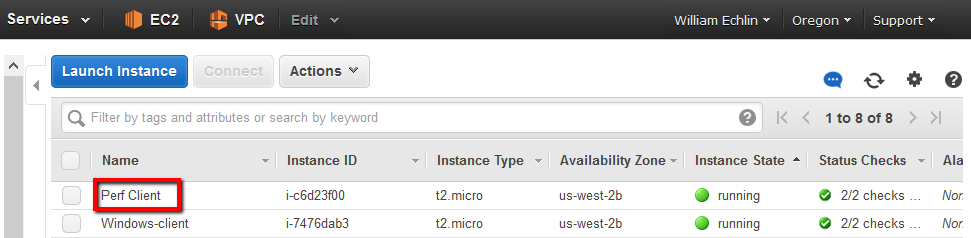
- You can check this is running up in your AWS account as follows:
And then login using ssh. So get the ‘Private IP’ (it’s IMPORTANT that it’s the private ip) address from your AWS account for this new server and then open the ssh client that’s already running on the windows master machine:
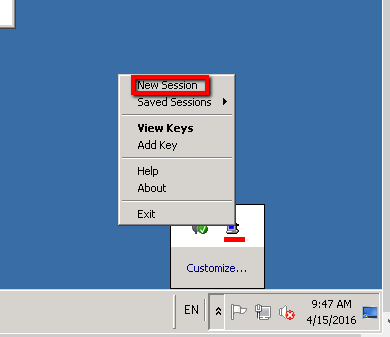
Enter the private IP address of the new linux machine and ‘Open’ the ssh terminal, accept the putty security alert and you should have your new linux terminal session. You just need to enter ‘ubuntu’ as the user name and you’re in.
- Check that JMeter is installed
Once you have the terminal open type this at the command prompt:
jmeter -v
And you should see the version of JMeter something like this…
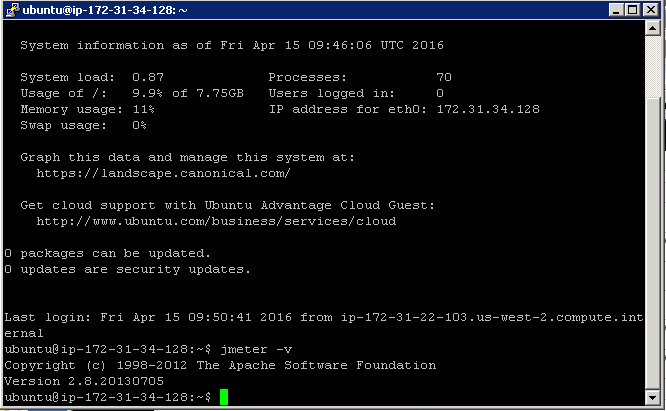
Which confirms that JMeter is installed. You can close this terminal. We’re ready to start configuring our Jenkins performance job and deploying our performance scripts to this new server.
If you get a message saying that JMeter is NOT installed then go through the next section. This will explain what to do if your Performance client isn’t installed correctly.
Part 5: Parameterise our JMeter Project
We’ve configured our JMeter project and we’re ready to set this up as part of our Jenkins jobs now. Only slight problem is that the hostname of our Rocket Chat server is going to change everytime we re-build and install Rocket Chat. That means the hard code Server Name we’ve entered in JMeter won’t work. So we need to parameterise this value in our JMeter project.
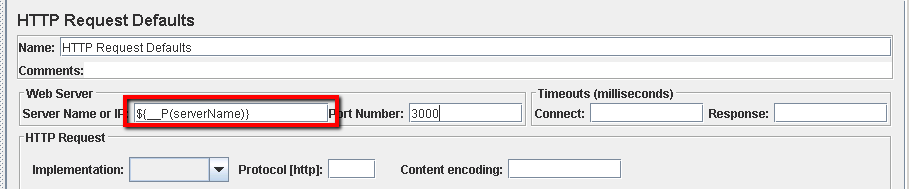
The aim is to pass the Rocket Chat hostname as a command line argument to JMeter when we kick off the performance test. To do this we need to update our JMeter ‘HTTP Request Defaults’ properties.
- In JMeter open the ‘HTTP Request Defaults’ config element
- Update the Server Name field with this string
${__P(serverName)}
Like this
- Save your JMeter project
Now when we run our JMeter project from our Linux performance machine we’ll be able to run it with a command line like this:
jmeter -n -t RocketChat.jmx -JserverName=ec2-54-201-180-143.us-west-2.compute.amazonaws.com -l rcPerfResults.jtl
Where the arguments we pass on the command line are:
-n – run in headless/non-gui mode
-t – use the RocketChat.jmx configuration file
-JserverName – run the test against the Rocket Chat server with this hostname
-l – log the results to the rcPerfResults.jtl file
Only slight problem with this is that the server name is hardcoded. We need to pick up the public or private Ip of the host that is running our Rocket Chat application. If you remember in one of the earlier modules when we configured the AWS machine that is running Rocket Chat we had a script in Jenkins that created a publicHostname.txt file. In this file we had the public host name of the Rocket Chat. This txt file is archived as part of the ‘BuildRocketChatOnNode’ job and then passed to other jobs that use values as environment varialbes. We’ll hijack this file to add the private ip of the Rocket Chat server too. We can then use this value in our jmeter command line.
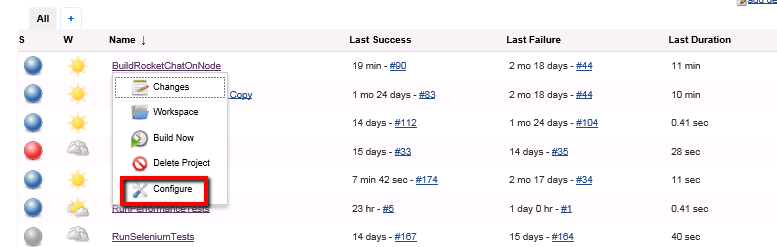
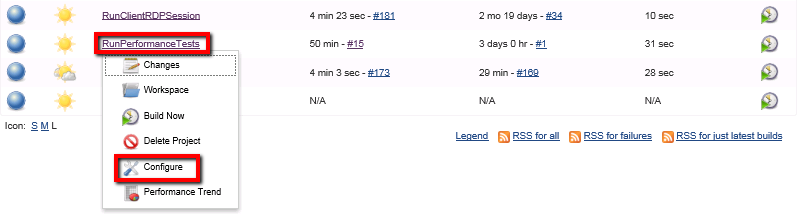
To configure this we’ll start by modifying the ‘BuildRocketChatOnNode’ job. On Jenkins dashboard click on the ‘Configure’ menu item for this job
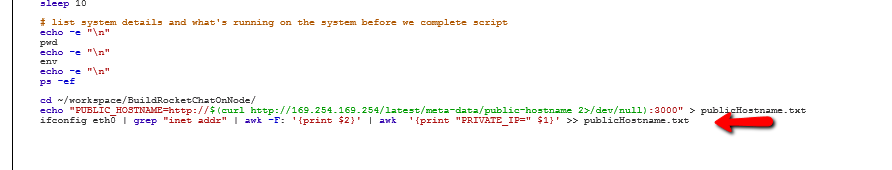
Scroll to the of the config page and find the “Execute shell” section. At the bottom of this script you’ll find these couple of lines:
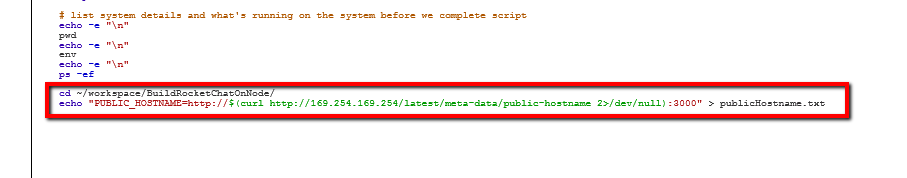
This is where we create the publicHostname.txt file. We need to add to this by including this line:
ifconfig eth0 | grep “inet addr” | awk -F: ‘{print $2}’ | awk ‘{print “PRIVATE_IP=” $1}’ >> publicHostname.txt
Once you’ve added this you should have:
Click the ‘Save’ button to save this.
This will run the linux ‘ifconfig’ command that spews out loads of network information for the host. We then run this through grep and awk to pick out the ip address and concatenate this with the text ‘PRIVATE_IP’. So it will add this line to the publicHostname.txt file:
PRIVATE_IP=172.31.29.xxx
We can then pass this publicHostname.txt file to our Jenkins Performance job and use the environment variable PRIVATE_IP to get the correct Jmeter arguments in the command line. So something like this:
jmeter -n -t RocketChat.jmx -JserverName=$PRIVATE_IP -l rcPerfResults.jtl
Don’t worry about this for now though, more on how we run this on the command line as we configure the Jenkins job in a moment. Before we do that we’ll need to run our ‘BuildRocketChatOnNode’ job so that we have the correct values added to our publicHostname.txt file

Once that job has completed, on your Jenkins machine you should be able to find this directory:
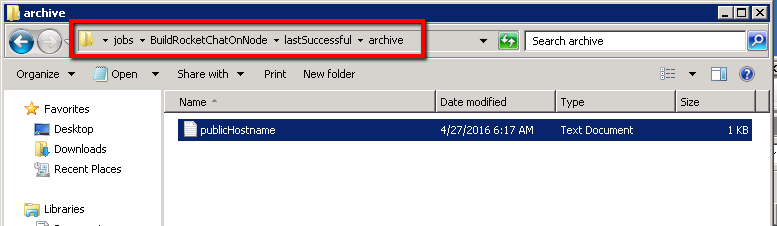
Opening this text file should confirm that we have two environment variables recorded in here.
All we need to do now is add the Jenkins Performance Plugin and configure the Jenkins performance job.
Part 6: Add and configure the Jenkins Performance Plugin
In Jenkins, in order to capture reports from JMeter we’ll add the ‘Performance Plugin’. Once this is installed and configured we’ll be able to chart the trend of performance results from one build to the next. It’s this trend that’s key to us spotting potential performance issues before it’s too late.
- Add the ‘Performance plugin’
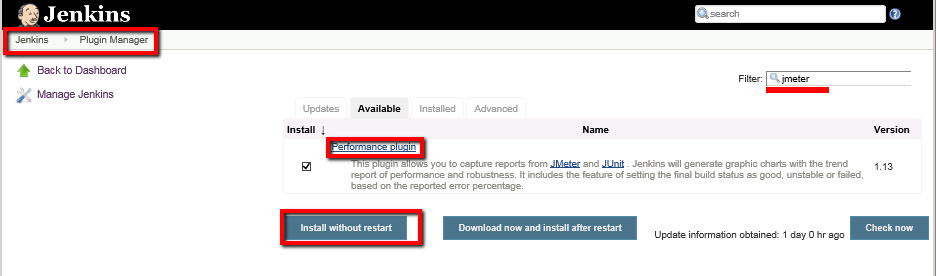
- Once this is installed you should see the plugin listed on the ‘Installed’ tab in the Plugin Manager page on Jenkins (you might need to apply the filter to see this amongst all the other plugins installed)
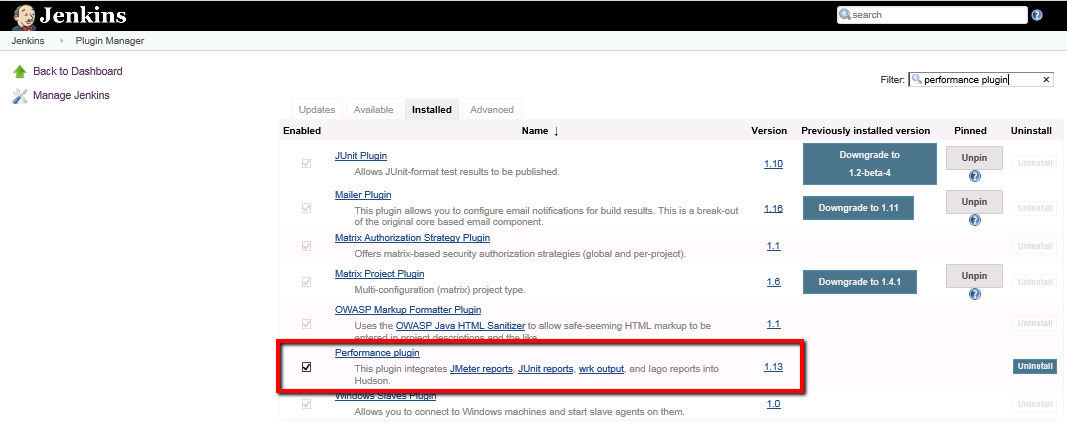
We have our ‘Performance Linux Client’ configured. We have the Jenkins plugins installed that we need. Now we’re in a position to create the Job to run this performance from Jenkins.
Part 7: Configure the Jenkins Job to Deploy our Performance Tests
As mentioned previously our performance test files ought to be stored in a source code control system (possibly Git or Svn or something similar). That way when we develop our JMeter tests on our Windows machine we’d check them into our source code control system. Then we’d configure our Linux performance host to check out these tests from our source code control system before running them.
We’ll look at doing this the in a later stage but for now we’ll just get Jenkins to copy the JMeter configuration files on to the Performance Server when we need them.
First then, we’ll copy the JMeter ‘.jmx’ file to our Jenkins master machine in the ‘userContent’ directory. With the file in this location it will be available to the Jenink’s jobs to copy to our Linux Performance Server. Let’s get started on this.
- On the Windows master machine find the RocketChat.jmx JMeter configuration file.
The file should be in this directory (or whereever you installed JMeter):
C:\Users\Administrator\Desktop\apache-jmeter-2.13\bin\RC
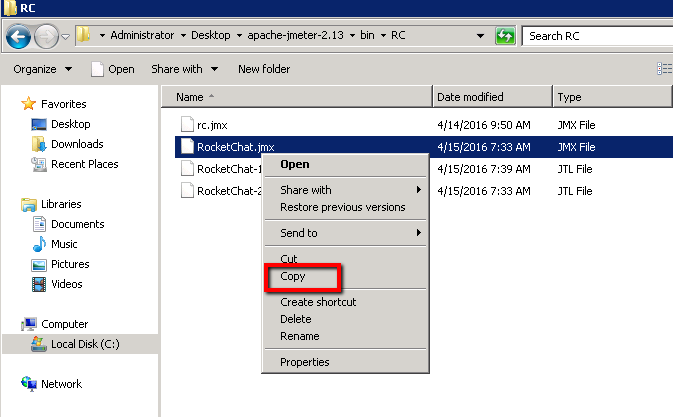
This then needs to be copied to this Jenkins directory:
C:\Program Files (x86)\Jenkins\userContent
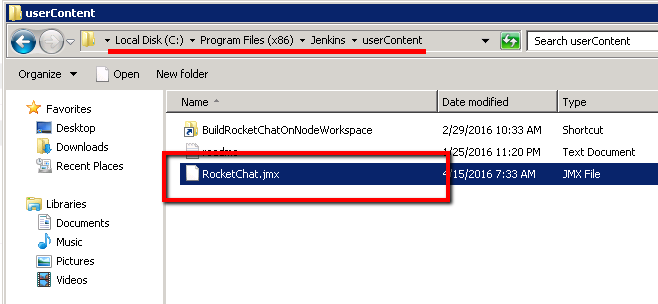
With this JMeter configuration file in the Jenkins ‘userContent’ directory it will be available to the new job that we’ll create next.
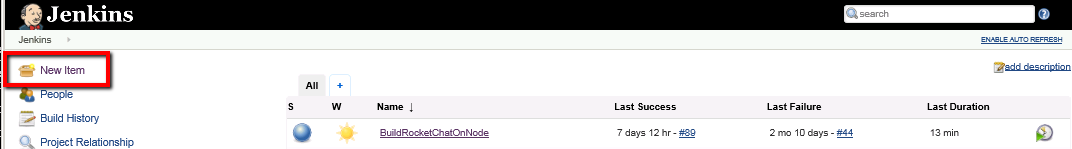
- Create the new performance job by clicking on ‘New Item’ on the Jenkins home page
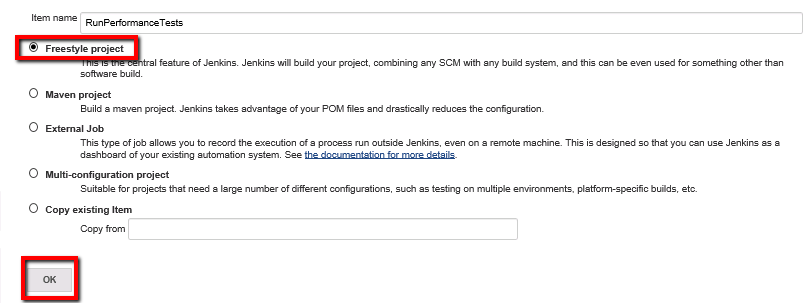
Select ‘Freestyle project’ and call your new item ‘RunPerformanceTests’
- Configure the new job
This new job needs to complete a couple of key tasks. First we need to ensure it runs on our Linux Ubuntu AWS performace instance. Then we need to copy over the JMeter ‘.jmx’ file and then run the JMeter test (from the command line). To acheive this configure the job as follows:
Project name: RunPerformanceTests
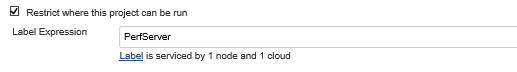
Restrict where this project can be run: <checked>
Label Expression: PerfServer
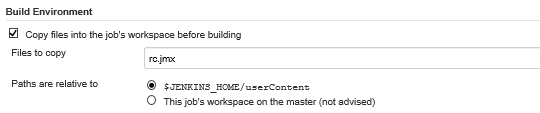
Copy files into the job’s workspace before building: <checked>
Files to copy: RocketChat.jmx
Paths are relative to: $JENKINS_HOME/userContent
These settins should look like this when configured:
Restrict Where this project can be run:
Copy files:
With the core settings configured we can now add a few build steps:
- The ‘Copy Artifacts’ Build Step
First build step is the copy artifact from other project. We need to pull the publicHostname.txt file in from another project as that contains the hostname where Rocket Chat is running. We’ll create this as follows:
Add the ‘Copy artifacts from another project’ build step
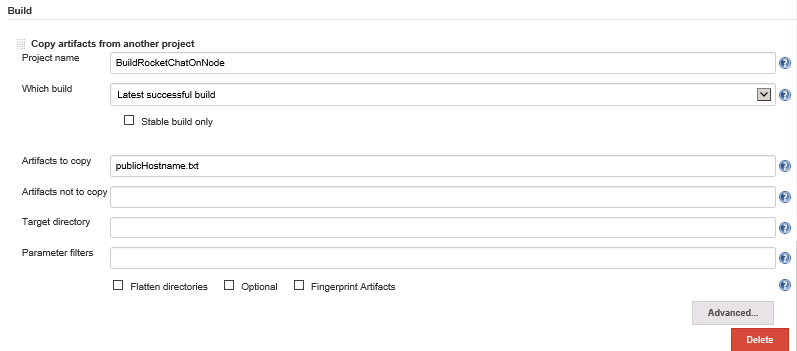
And then set these parameters:
Project Name: BuildRocketChatOnNode
Which Build: Latest successful build
Artifacts to Copy: publicHostname.txt
So this build step should look like this:
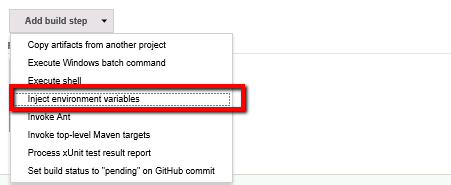
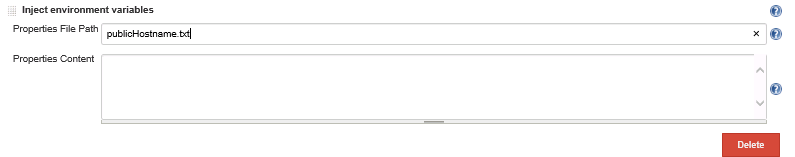
- The ‘Inject Environment Variables’ Build Step
Next build step is the ‘Inject Environment Variables’ build step:
And for this one we need to get Jenkins to parse the data in the publicHostname.txt file and create an environment variable that will tell our performance host machine where Rocket Chat is running. Create this with just:
Properties File Path : publicHostname.txt
Which should look like this:
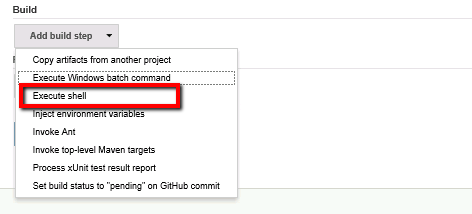
- The ‘Execute Shell’ Build Step
Now add the execute shell build step that will run the JMeter tests.
And set this up as follows:
Command:
jmeter -v
echo $PUBLIC_HOSTNAME
echo $PRIVATE_IP
jmeter -n -t RocketChat.jmx -JserverName=$PRIVATE_IP -l rcPerfResults.jtl
So the first three lines give us a little bit of debug info if we need it. The forth line starts and runs our JMeter tests sending the results to the rcPerfResults.jtl file.
- Run and test the Performance Test Execution
Lets just run this quickly and check that we see the results we expect. Click ‘Build Now’ for the ‘RunPerformanceTests’ job from the Jenkins home page

Then check the log file for the build
Which should give you something like this:
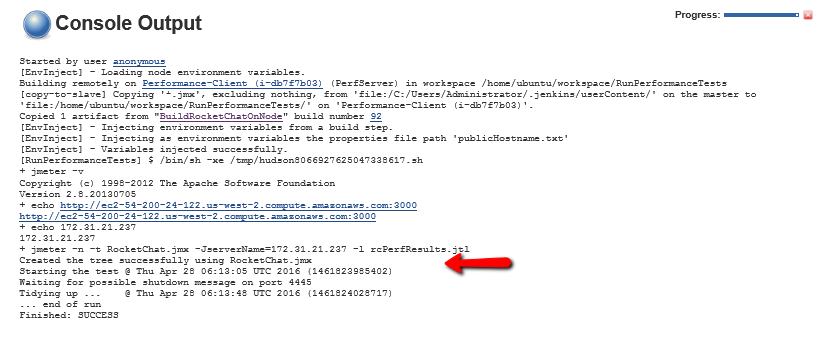
Now all we need to do is configure a Post Build Build Action that publishes the performance report.
- Configure the Post Build Performance Report
Next then add a post build task, which should give you the option to add a Performance Report as we have the Jenkins Performance Plugin installed.
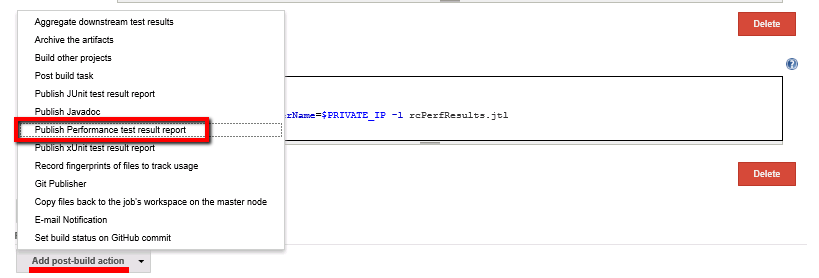
Click on the ‘Add post-build action’ button and select ‘Publish Performance test result report’
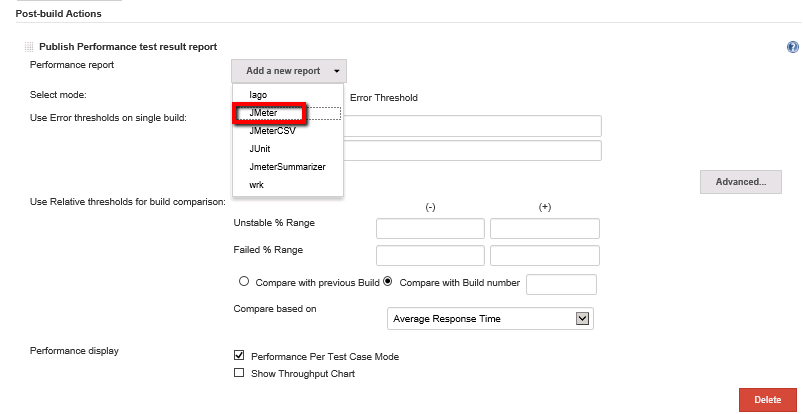
In this build job section click the ‘Add New Report’ button and select ‘JMeter’ :
IN the new Report file field that is displayed we just need to add our ‘rcPerfResults.jtl’ file name:
Report files: rcPerfResults.jtl
Which gives us this …
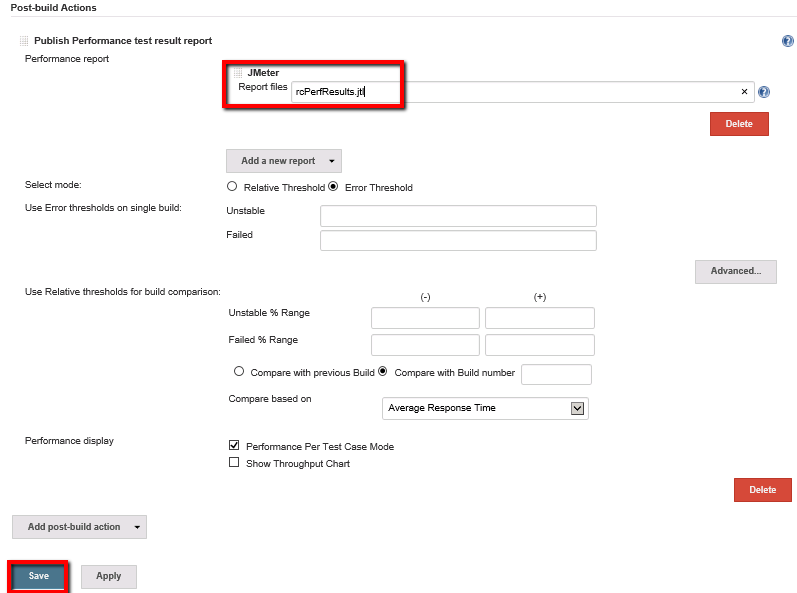
Save the whole job and return to the Jenkins home page. We’re ready to run Performance Tests from Jenkins now.
Part 8: Check the Performance Job and Configure in the Whole Build Chain
Everything is configured now. We need to check our ‘RunPerformanceTests’ job in isolation and then link this job into the whole build chain.
- From the Jenkins home page click on the ‘build now’ icon for the ‘RunPerformanceTests’ job:

As the performance reports are ‘trending’ reports you may want to run this job two or three times. That way when you view the results we’ll have some trend data to view. So click the build job icon again.
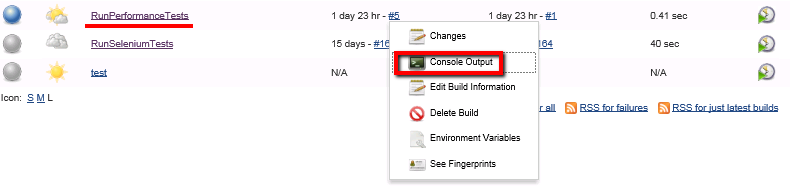
Once the job has completed for the 2nd or 3rd time check the build job results by clicking on the job name:

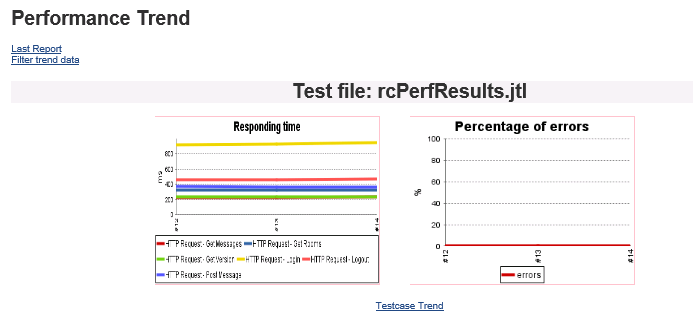
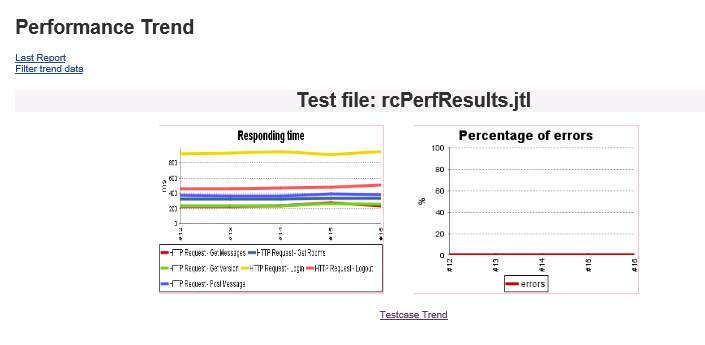
From here you’ll see the Performance Trend graphs:
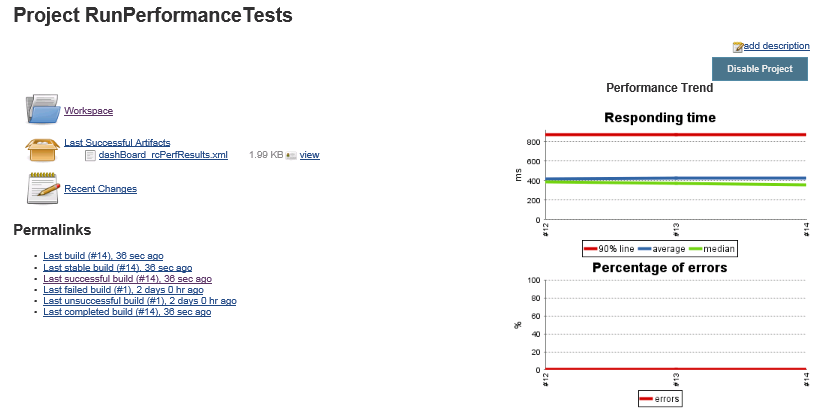
And if you click on the ‘Performance Trend’ links you can drill down into more detail (both of these charts can be viewed in a larger scale by clicking on them):
Now all we need to do is add this to the chain of other jobs that build and test our RocketChat application.
- Update ‘RunPerformanceTests’ to run after ‘RunApiTests’
From the Jenkins home page we’ll need to modify the ‘RunPerformanceTests’ job so that it waits for the ‘RunApiTests’ to finsh then starts. Configure the ‘RunPeformanceTests’ job
Set the parameters for the ‘Build after other projects are built’ option:
Build after other projects are built: <checked>
Projects to watch: RunApiTests
Trigger even if the build is unstable: <set>
This should give us the following:
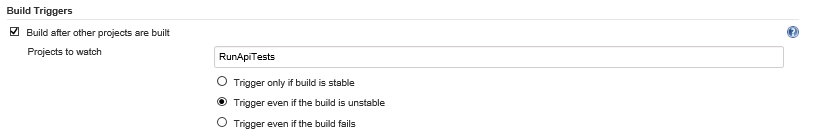
Where we will be waiting for the ‘RunApiTests’ to complete. Even if the ‘RunApiTests’ fail we want to run our performance tests. So we’ve set this to trigger even if the build is unstable.
Save the changes to this job and we’ll check the test jobs all run in turn.
- Check all the test jobs run in sequence
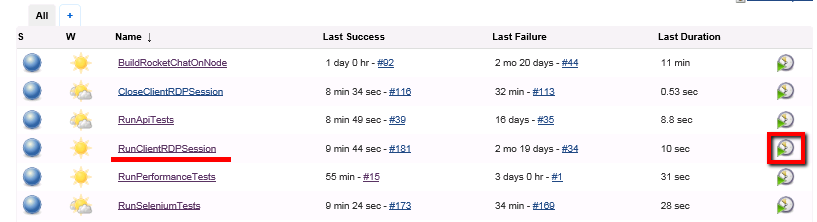
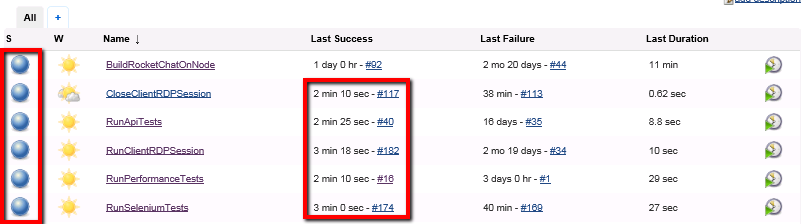
Again from the Jenkins main home page we’ll manually trigger the build of the ‘RunClientRDPSession’. This is the job that’s triggered after the Rocket Chat build is complete. We already have Rocket Chat running so we’ll simulate the run from this point in the chain.
What we should see once we’ve started this is
i. the RDP session open to the client windows test machine
ii. the browsers open in turn as the Selenium tests run
iii. the Api tests run in the background
iv. the RDP session close
v. the performance tests run in the background
Both the Api and performance tests are running in the background so not a lot to see when these run. However, on completion we should have a full set of passed test results all run in sequence:
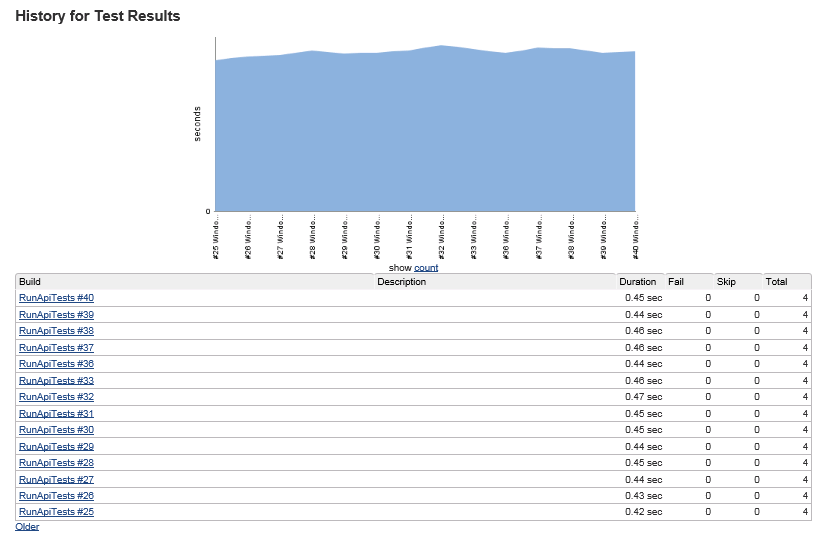
At this point you can drill down into the Api tests and check these results. Click on the build number for the ‘RunApiTests’ job and then select ‘History’ or ‘Test Results’:
Then do the same to check the performance test run results. click on the link for the ‘RunPerformanceTests’ job and then select ‘Performance Trend’:
And there we have it. A full test run. End to end, functional tests with Selenium, Api functional tests with SoapUI and Api performance tests using JMeter. All run with a single click of a button.
Conclusion
Once you start to get a feel for Jenkins building up each of the blocks to create an end-to-end test run covering Gui functional, Gui Api and performance tests isn’t too difficult. Admitidly we’ve only touched the surface of these tools like Selenium, SoapUI and JMeter. With the basics though it’s easy to start building out a lot of these tests and increase the test coverage significantly.
The key from here though is making sure the build and the test run are run on a regualr basis. Either configuring the build job for Rocket Chat to run every night or triggering it from source code check-in monitoring (a topic for another course). Kick everything off automatically on a regular basis AND add a few test cases each day. Before you know it you’ll have a large regression pack.
What’s more is you’ll soon find it easier to add an automated test case than writing and running a manual test case. And once you hit this you’ve nailed test automation!