One important aspect to monitor on any test management project is the time it takes to execute a number of test cases. Capturing and reporting this information usually drives the average QA engineer slightly mad (after all you only need to find one bug during the execution and all figures will be distorted). So yes there is a certain amount of ambiguity associated with tracking this.
Having said that there is some merit to this. Not least it helps provide some idea on the resources needed for a particular project. If you can estimate the testing duration (and provide past evidence) it’s far easier to argue the case for the right level of resources for future project. So it’s not an exact science but it’s a very important one.
For example you might have a known set of regression suites that you will always need to run as part of a release. Tracking this and recording previous time to execute from within your test management tool can be useful. Combine it with previous defects found in those runs and it’s even more useful. You’ll only have an estimate for future runs but that estimate is based on previous evidence. This gives you an evidence based estimate for a significant part of a new project. And that counts for a lot when you’re arguing for resources and man power.
“In the last project we ran X regression test sets, it took us Y man hours to run and we found Z serious regression issues. Fine if you don’t want to give us those resources this time round but I’m telling you that there’s a high probability we’ll miss Z serious regression issues”.
That’s a powerful argument you can put forward to a project manager when getting resources allocated to your test management project. And If the actual time deviates significantly from previous runs due (maybe due to high bug find rates) then at least you have a stick to beat the development team with.
So three key figures to help with this are:
- Estimated Run Time
- Average Run Time
- Actual Run Time
These figures can be applied to both the execution of a testcase and the execution of a whole test set (a collection of testcases). In the following example we’ll see how QAComplete handles this.
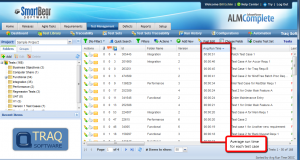
In the first instance if we look at cases we’ll see that we can track the average time for execution at the case level. So each time a testcase is executed as part of a set that result is aggregated with previous executions give us this statistic.
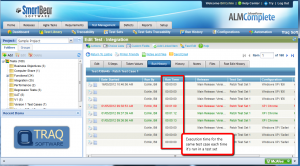
To see how this value is determined we can look at the execution history and see individual runs.
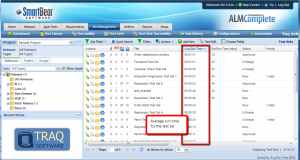
Again for a set we can look at the average execution time for a set.
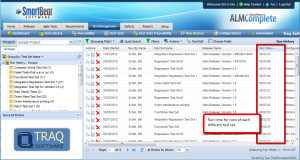
If we drill down on the set we can see the individual execution times too.

And we can see this same information for every execution under the ‘Run History’ area.
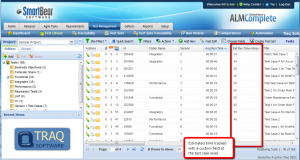
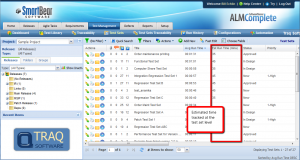
So this gives us average and actual values. From these we can spot anomalies where actual runs (at the set or case level) take longer than the average. Usually this is enough but we can start adding in other values like Estimated Run time. This has to be setup as a custom numeric field at the case or set level.
Estimated time tracked at the case level
 Estimated time tracked at the set level
We can then look at execution time per testcase or set in the following QAComplete reports.
- Test Coverage Run Details by Test Set Report
- Test Run History by Test Set
It’s not difficult to start tracking this sort of information. In fact most test management tools will track this automatically. So it’s just a question of sifting through that data and creating the reports you need. Reports that will go a long way towards helping with the issues we all have about getting the right level of resources allocated to a project.
 To see how this value is determined we can look at the execution history and see individual runs.
 Again for a set we can look at the average execution time for a set.
 If we drill down on the set we can see the individual execution times too.
 And we can see this same information for every execution under the ‘Run History’ area.
 So this gives us average and actual values. From these we can spot anomalies where actual runs (at the set or case level) take longer than the average. Usually this is enough but we can start adding in other values like Estimated Run time. This has to be setup as a custom numeric field at the case or set level.
Estimated time tracked at the case level
 Estimated time tracked at the set level
 We can then look at execution time per testcase or set in the following QAComplete reports.