Custom Dashboards and Filters
There’s no point putting all this data in and organising everything if you can’t see where you’re up to on your projects. Jira provides you with dashboards that can be customized to your requirements and filters you can setup and save. Both dashboards and filters allow you to see exactly where you are with your particular project.
The start of all this is then is the System Dashboard. This is the dashboard you’re presented with when you log in and when you select the ‘View System Dashboard’ option.

Each dashboard is just a one page container for a number of gadgets. Where a gadget is a panel that displays a particular set of informations. Some dashboards are shared between users of Jira (the System Dashboard for example) and some you create just for yourself. You might, for example, create a dashbaord for yourself that contains all the information you need for a particular project. That dashboard might contain information about your issues assigned you, age those issues are taking to be resolved and some statistics based on issue priorities.
What we’ll look at here, in this module, is creating new dashboards and customising them to display the Project information you’re interested in. To start with then lets create a new dashboard.
Creating Dashboards
To create a new dashboard, select the ‘Manage Dashboard’ option for the Dashboards drop down.

This, ‘Manage Dashboards’ page displays all our dashboards and all the dashboards that have been shared with us. From here we get the option to create a new dashboard with the ‘Create New Dashboard’ button.

All we need to do here is give our new dashboard a name and specify who we’re going to share it with. We’ll keep it simple for now and just provide the name (we won’t share it). We’ll build a dashboard for our ‘ACME Delivery System’ project so we’ll provide the name “Delivery System Dashboard’ and click ‘Add’. We’ll start out with a ‘blank dashboard’ too.
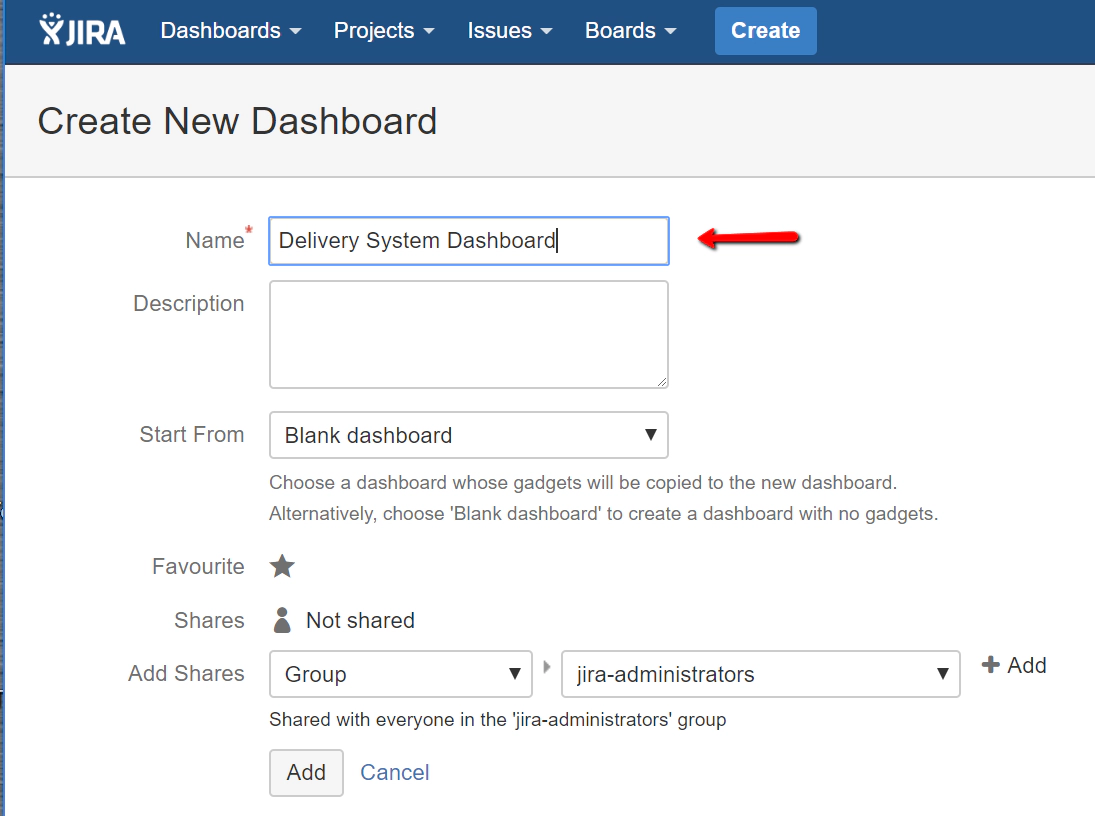
At this point your new dashboard should be added to your Favourites list automatically. You should be able to click the dashboard name link and see what you have on your new dashboard.

Nothing too exciting when you view this dashboard, but you do have the option to start adding new gadets to your dashboard now.

When you need to view this dashboard you’ll always find this new dashboard in the Dashboard drop down list now.

So now we have the dashboard we’ll want to customise it by adding new gadgets, editing the layout and sharing the dashboard. That’s what we’ll look at next.
Customising Dashboards
You can customise your dashboard by adding new gadgets. Either click the ‘add a new gadget’ link or the ‘Add gadget’ button. Either way you’ll be presented with a list of gadgets that you can search through.
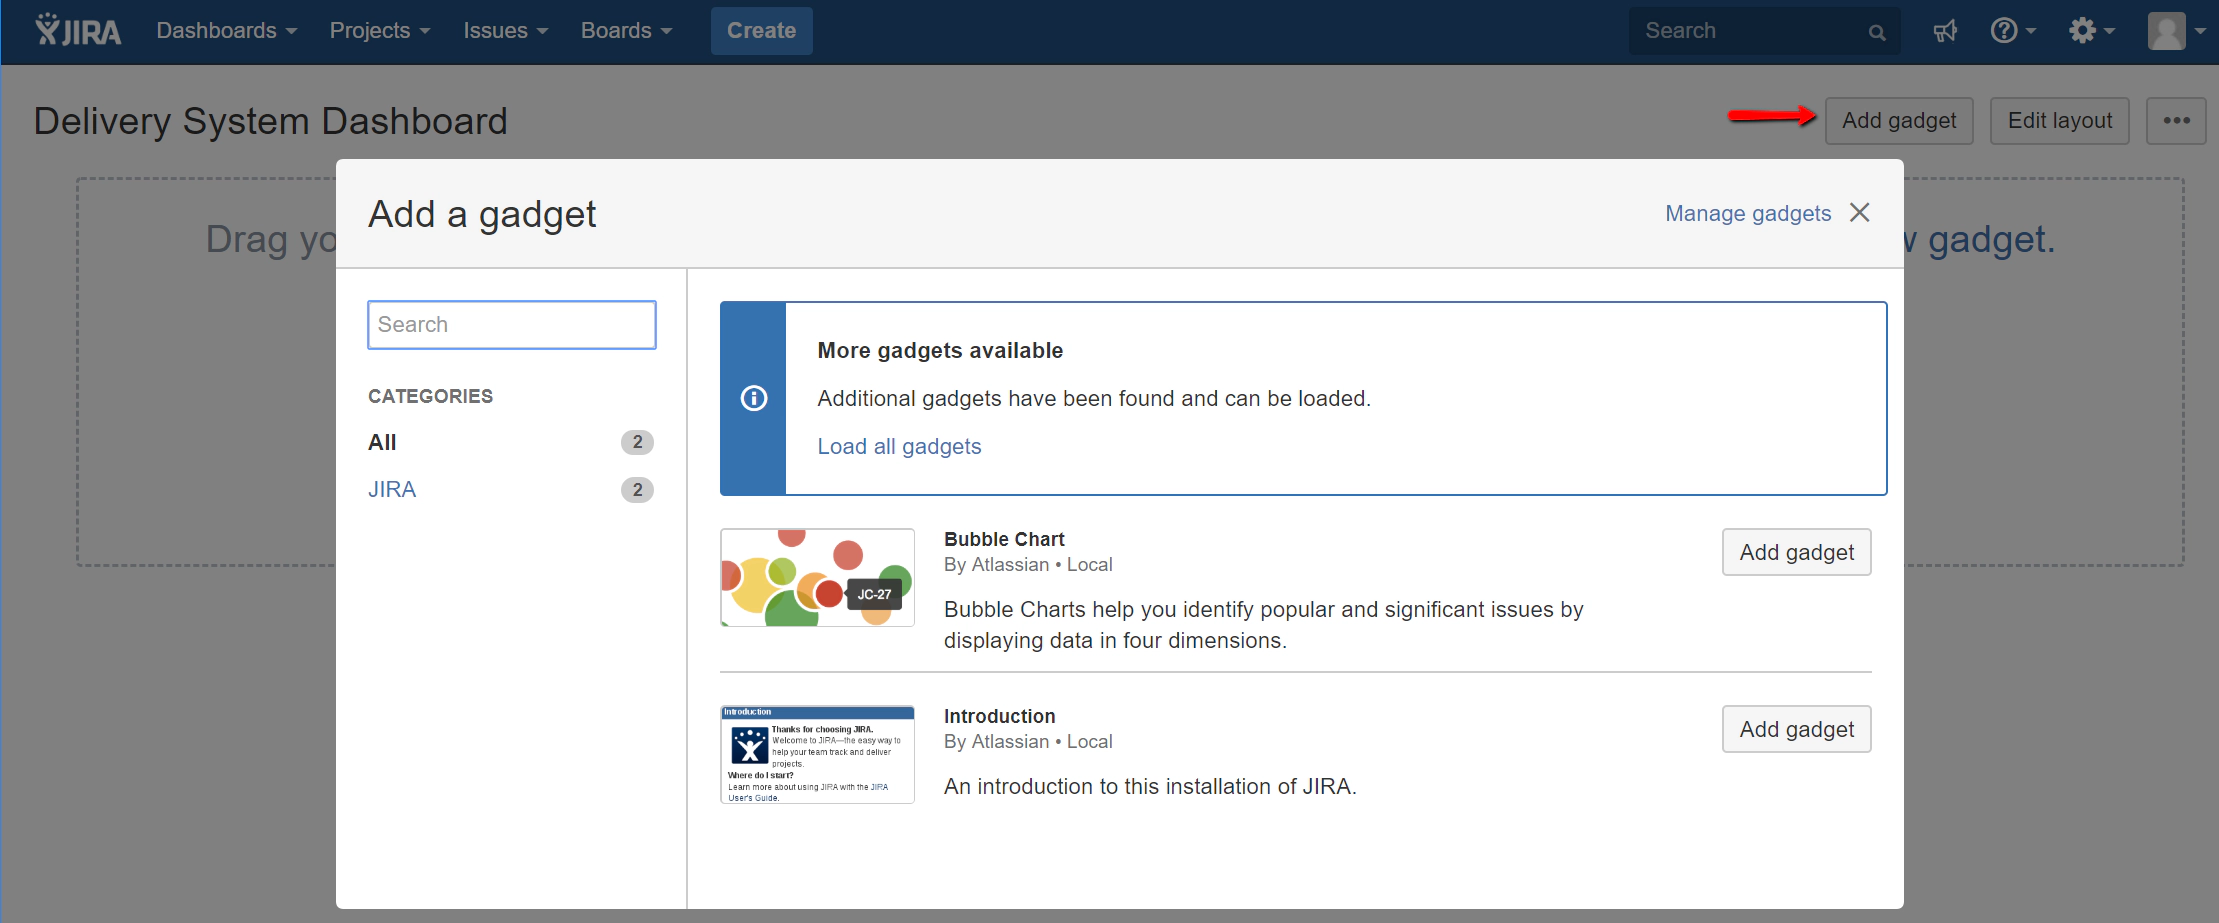
First off if you see the “More gadgest available” message click the ‘Load all gadgets’ link. This way you know you’re working from the full list of available gadgets. What you should see then is a list of categorise for the gadgets (e.g. Charts, JIRA, Other, Wallboard). To start with lets just add the ‘Assigned to Me’ gadget. Click on the ‘Add Gadget’ button for this gadget.
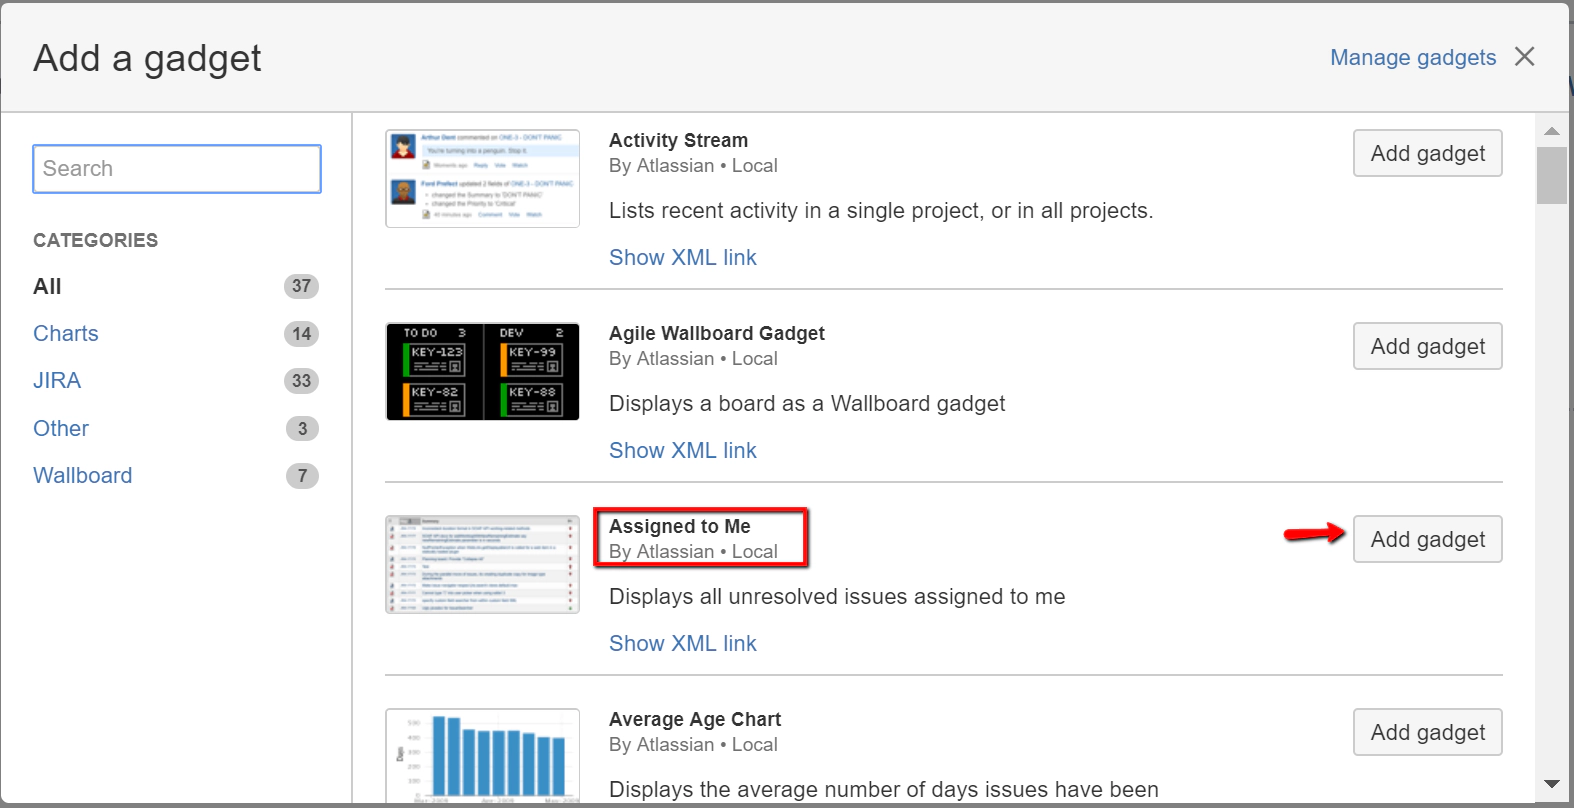
In the background you should see the gadget added. Let’s just add one more gadget before we finish though. Search for the ‘Issue Statistics’ Gadget and add this.
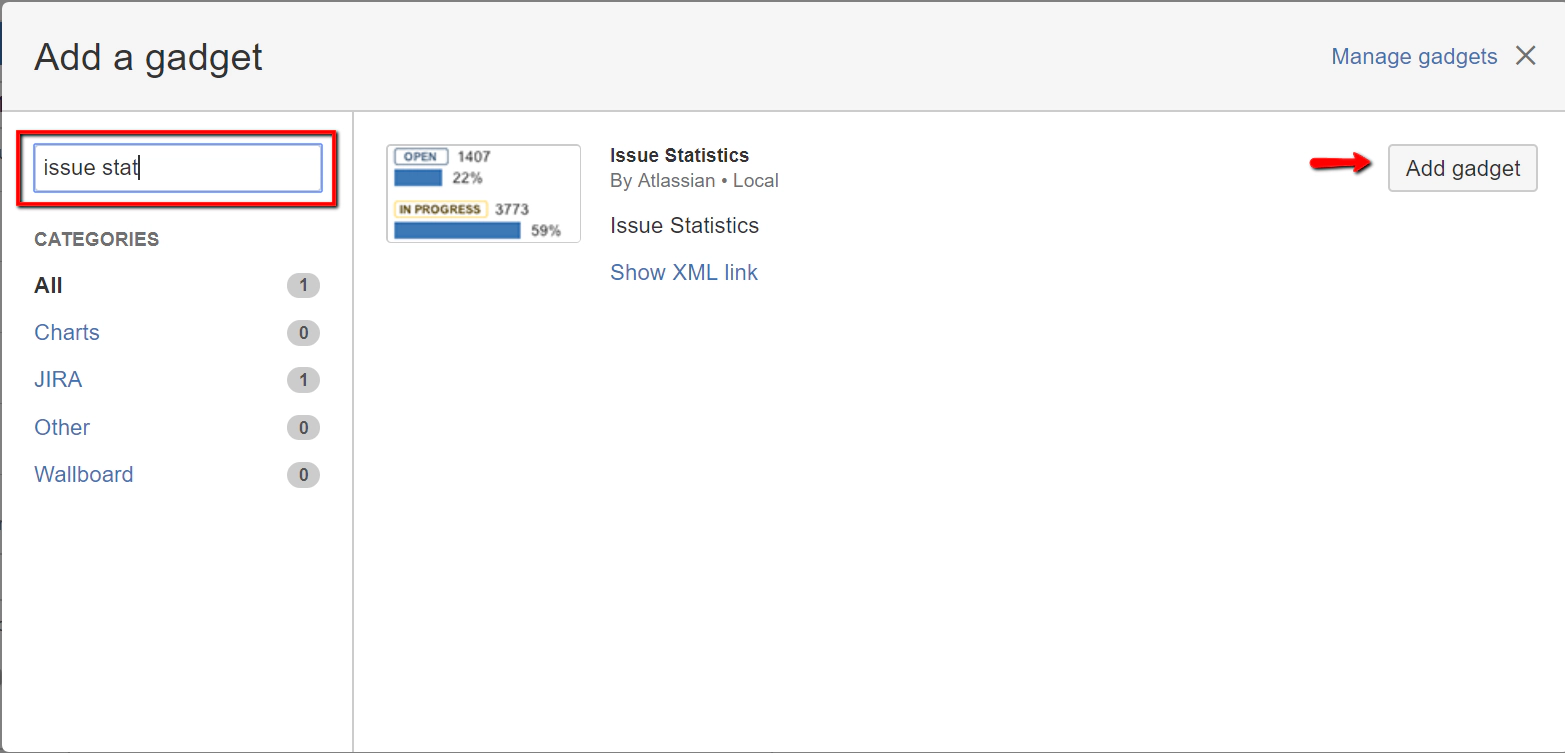
Once you’ve closed the ‘Add a Gadget’ dialogue box we can start customising those gadgets. First off move the ‘Assigned to Me’ gadget to the top right hand side of the dashboard page. Now we have the layout correct we can customise the individual gadgets.
You’ll notice that the gadgets aren’t actually displaying any information. They are waiting for you to configure them. Let’s configure the ‘Issue Statistics’ gadget first. We’ve created a dashboard for our ‘ACME Delivery System’. So let’s filter the data on this gadget so that it only displays statistics for the ‘Delivery System’ project. Type the project name into the ‘Filter’ field. You can also change the statistic type if you like. Perhaps select ‘Priority’ so that your stats are broken down by issue priority.
On the ‘Assigned to Me’ gadget we’ll just take the defaults.
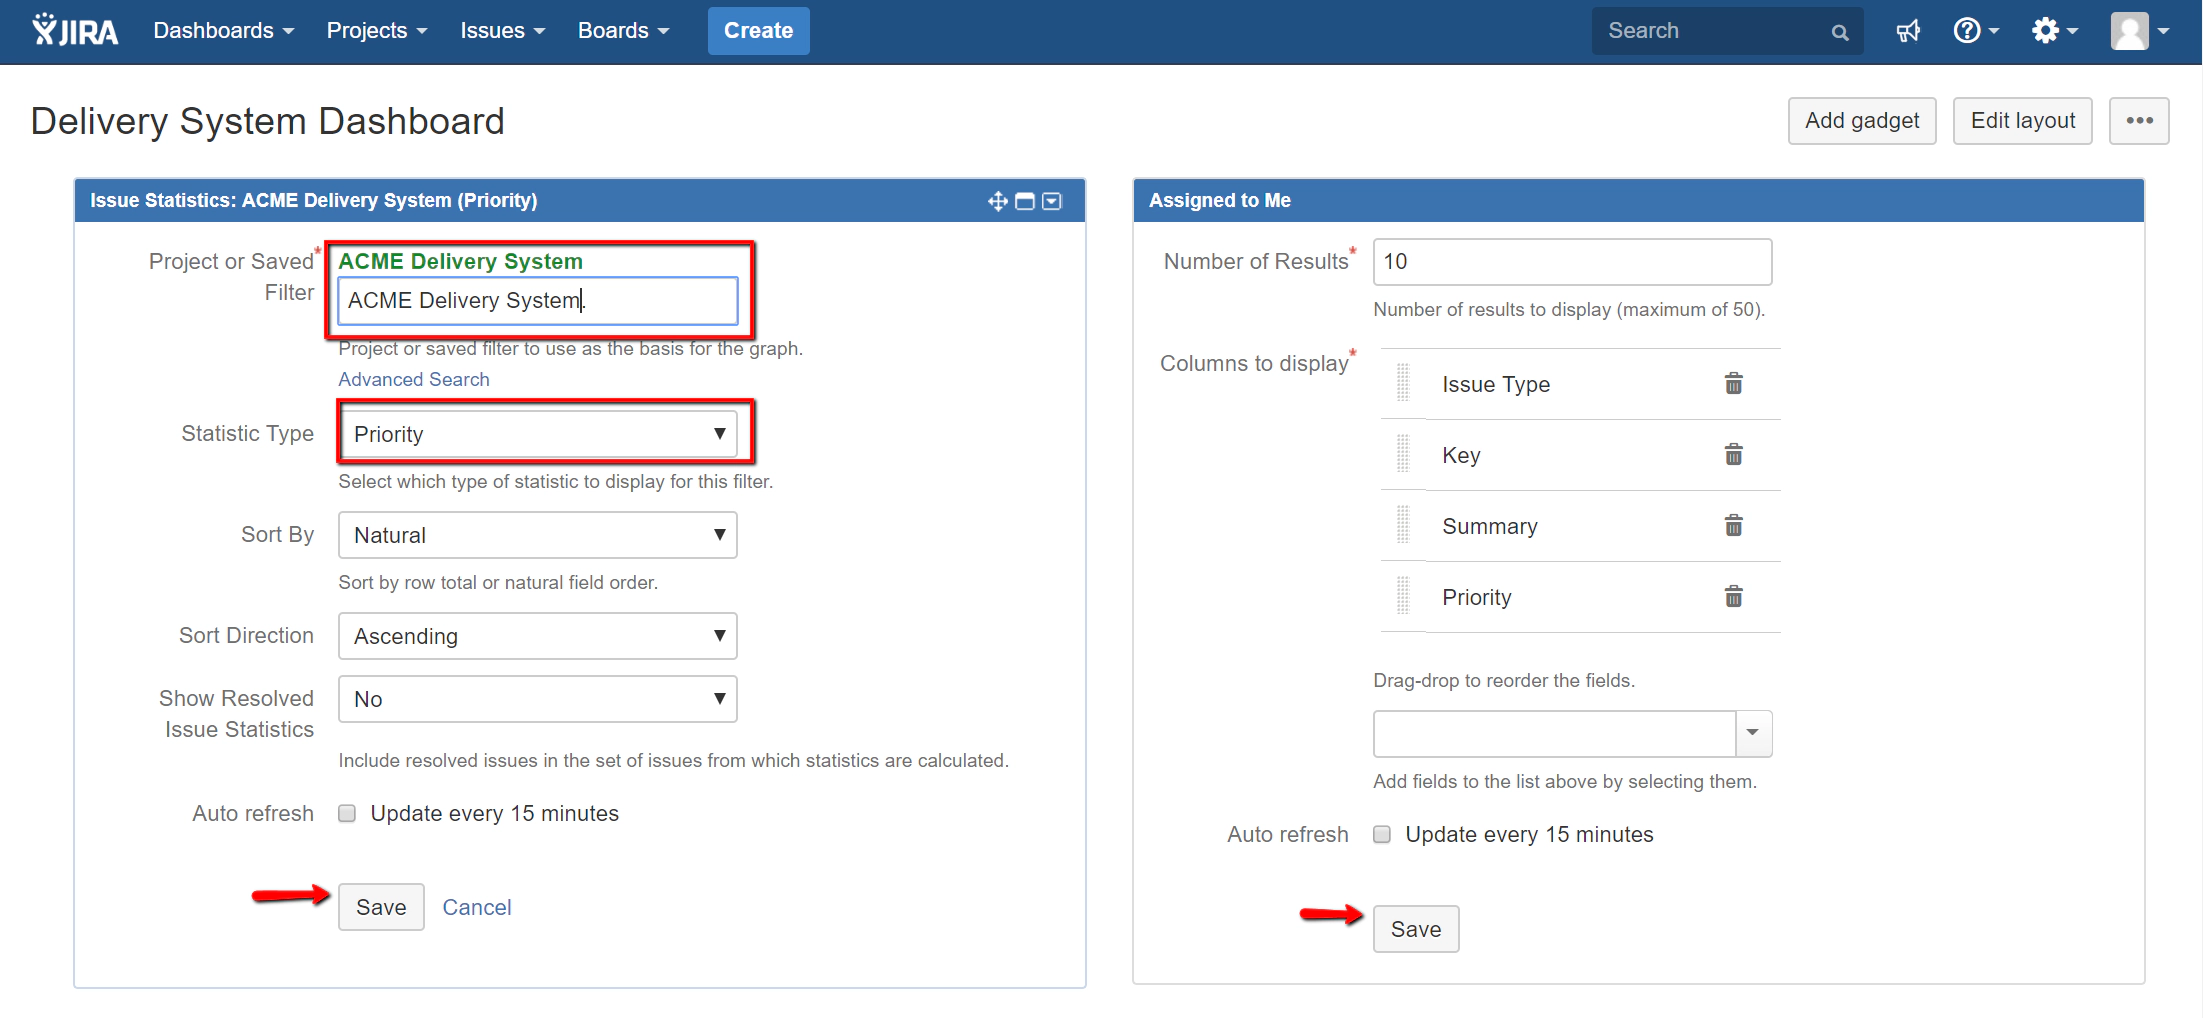
Once you click ‘Save’ you’ll see the data for both gadgets.
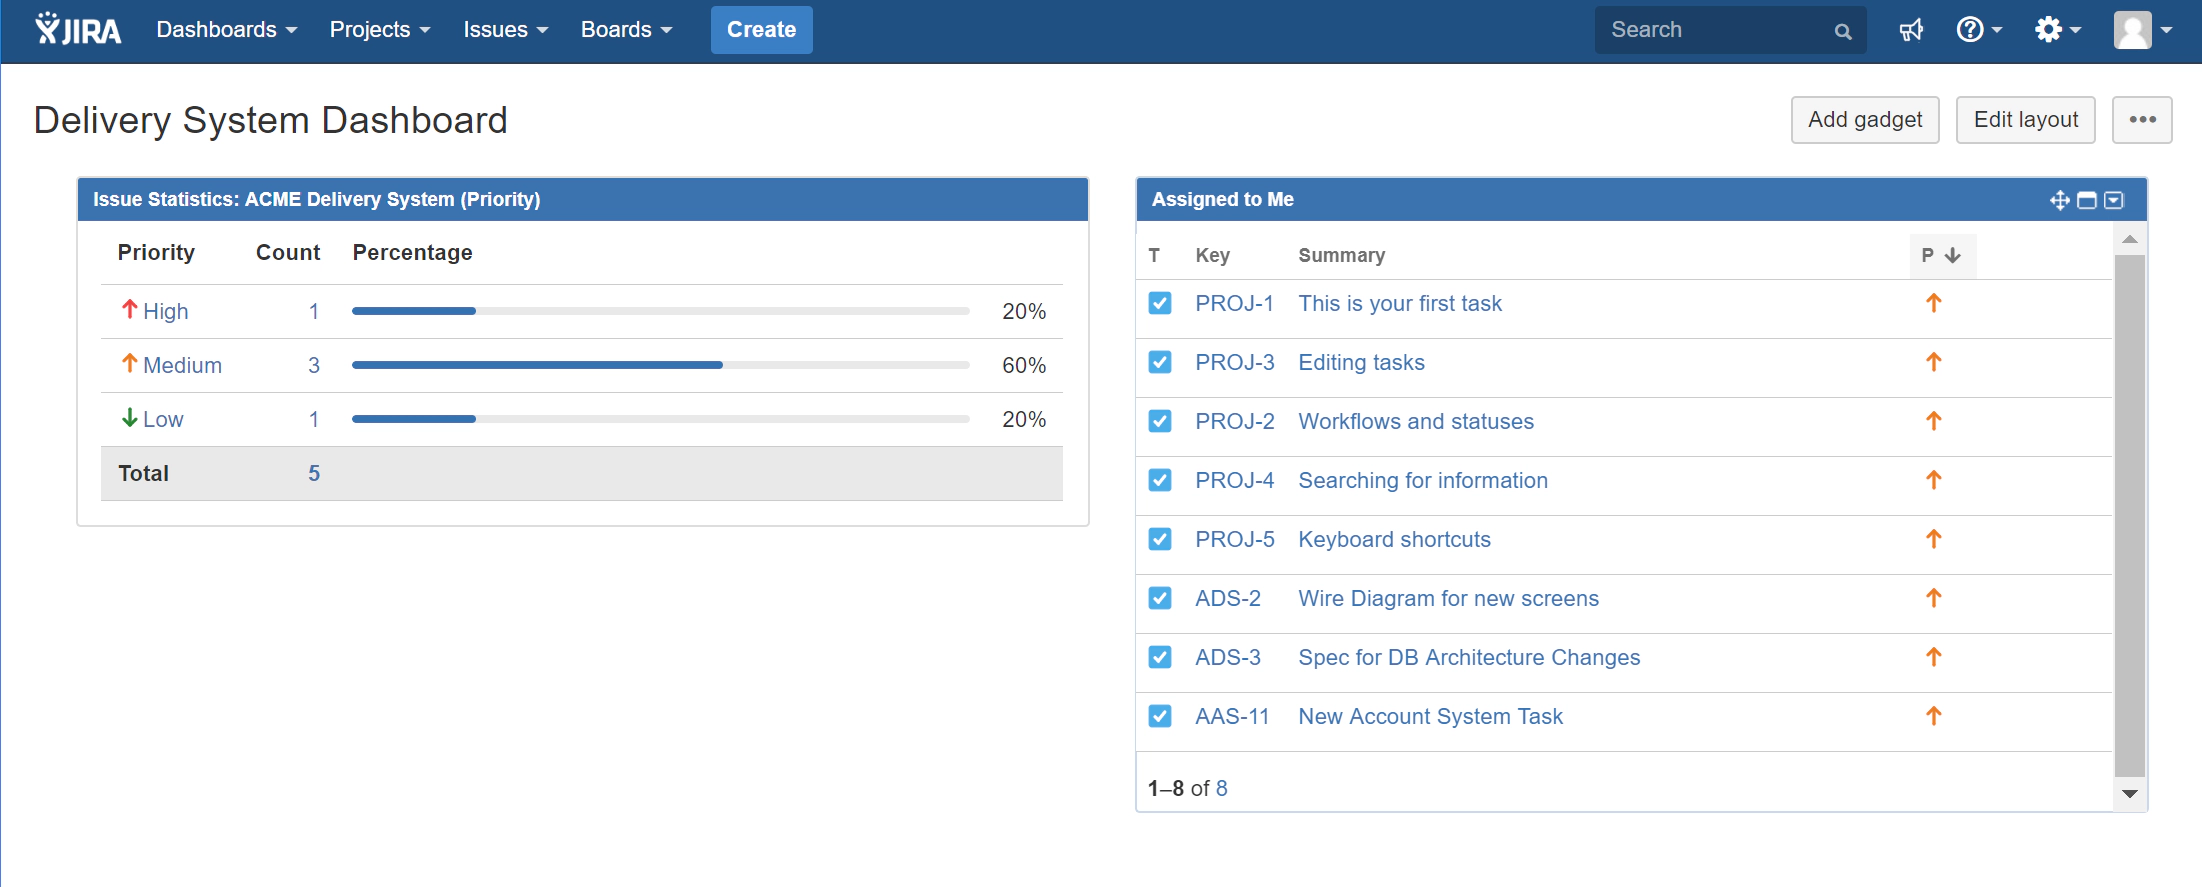
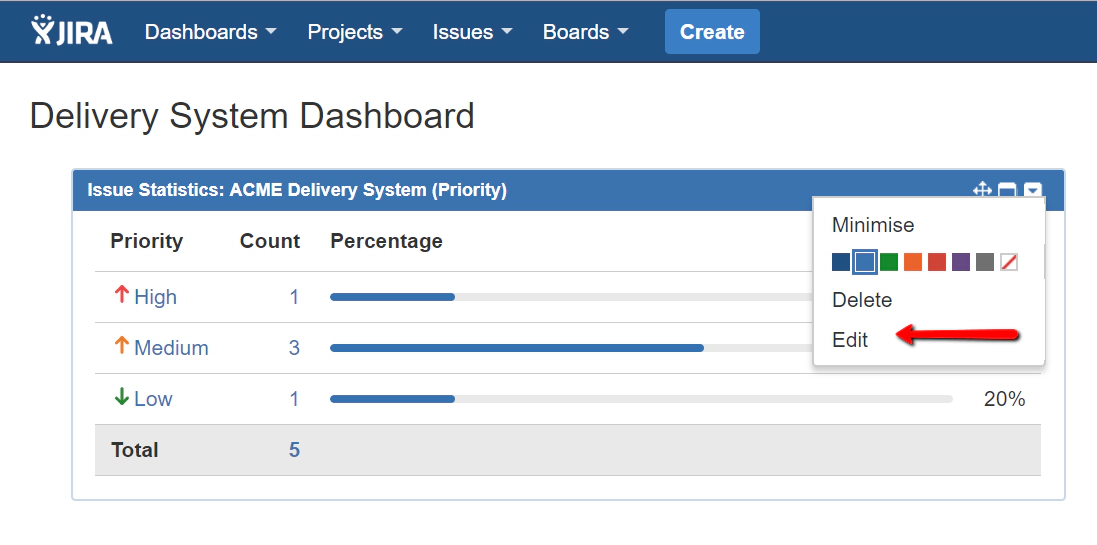
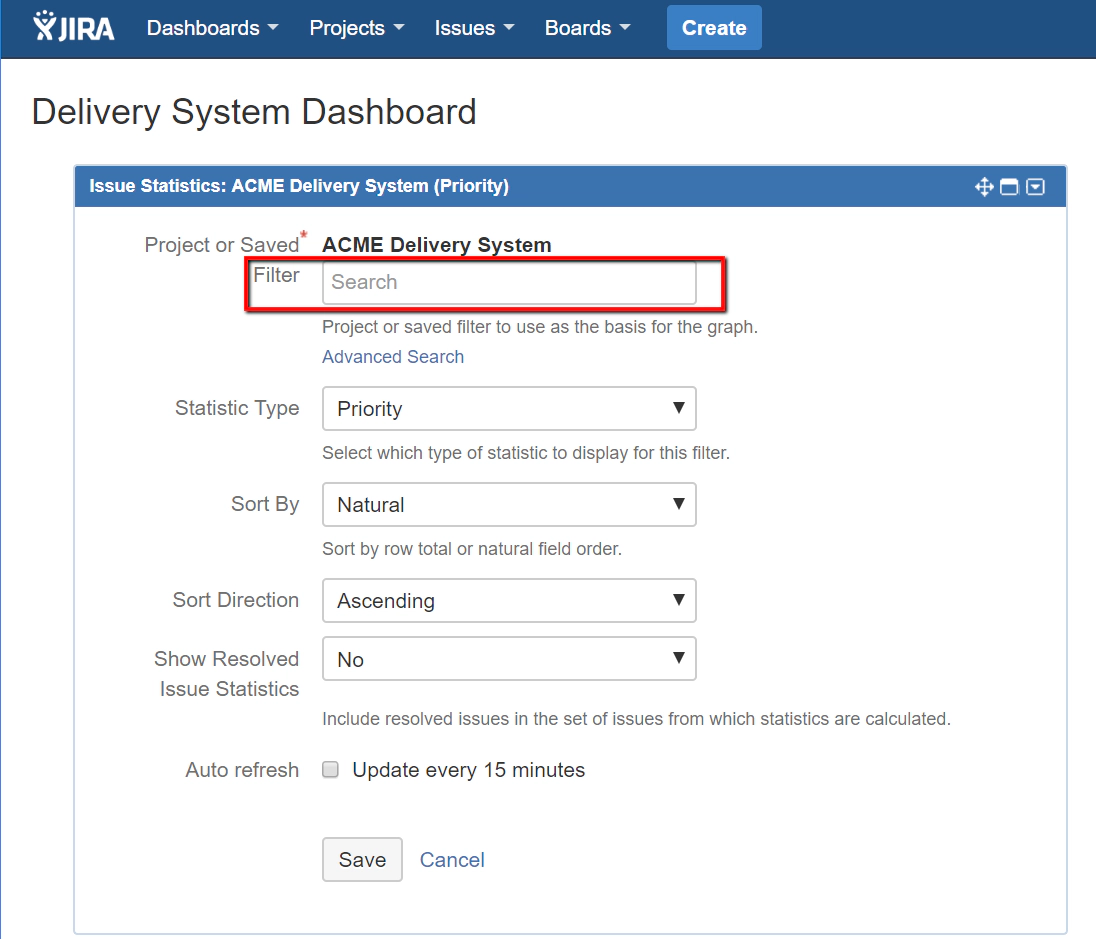
That’s a good starting point for your ‘Delivery System Dashboard’. From here you should find it simple to experiment with adding more gadgets. One thing worth noting is that many gadgets, when you add them, allow you to apply a filter. For example when you configure the ‘Issue Statistics’ filter.
You can apply a filter that narrows down the data that the gadget displays.
It’s these filters that we’re going to look at creating next.
Creating Filters
By default on the ‘Issues’ drop down you’ll see a ‘Filter’ section.
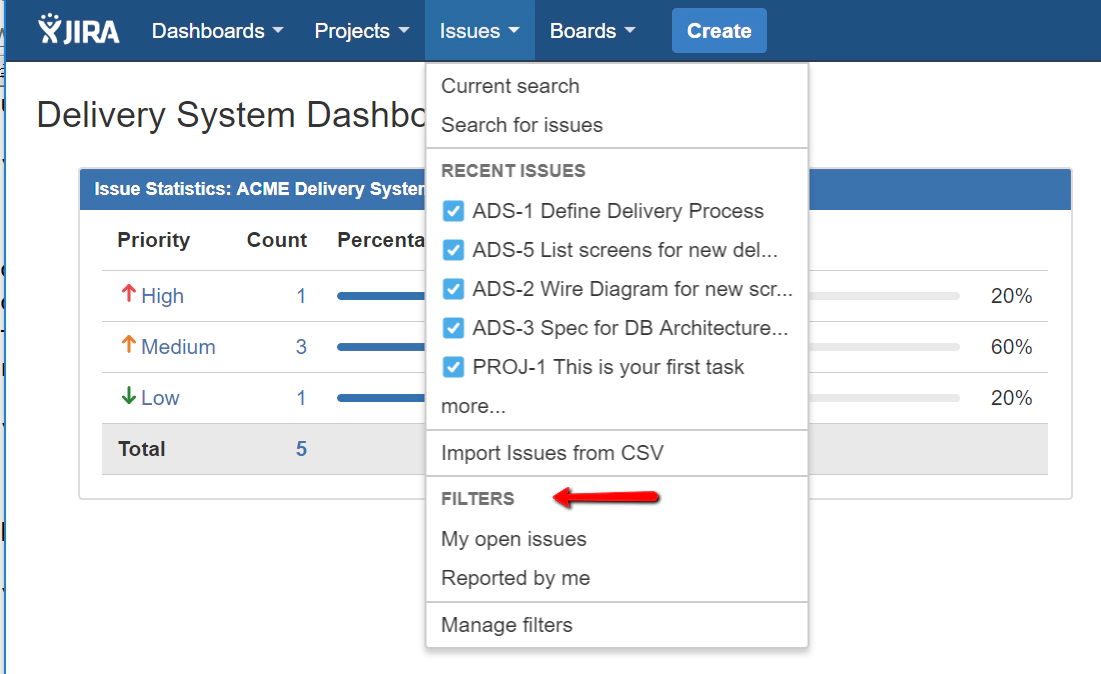
These are pre-defined search critera that show you a specific set of Jira records. If you click on the ‘My Open Issues’ filter you’ll see (not un-surprisingly) a list of issues ‘assign’ to you for all projects.
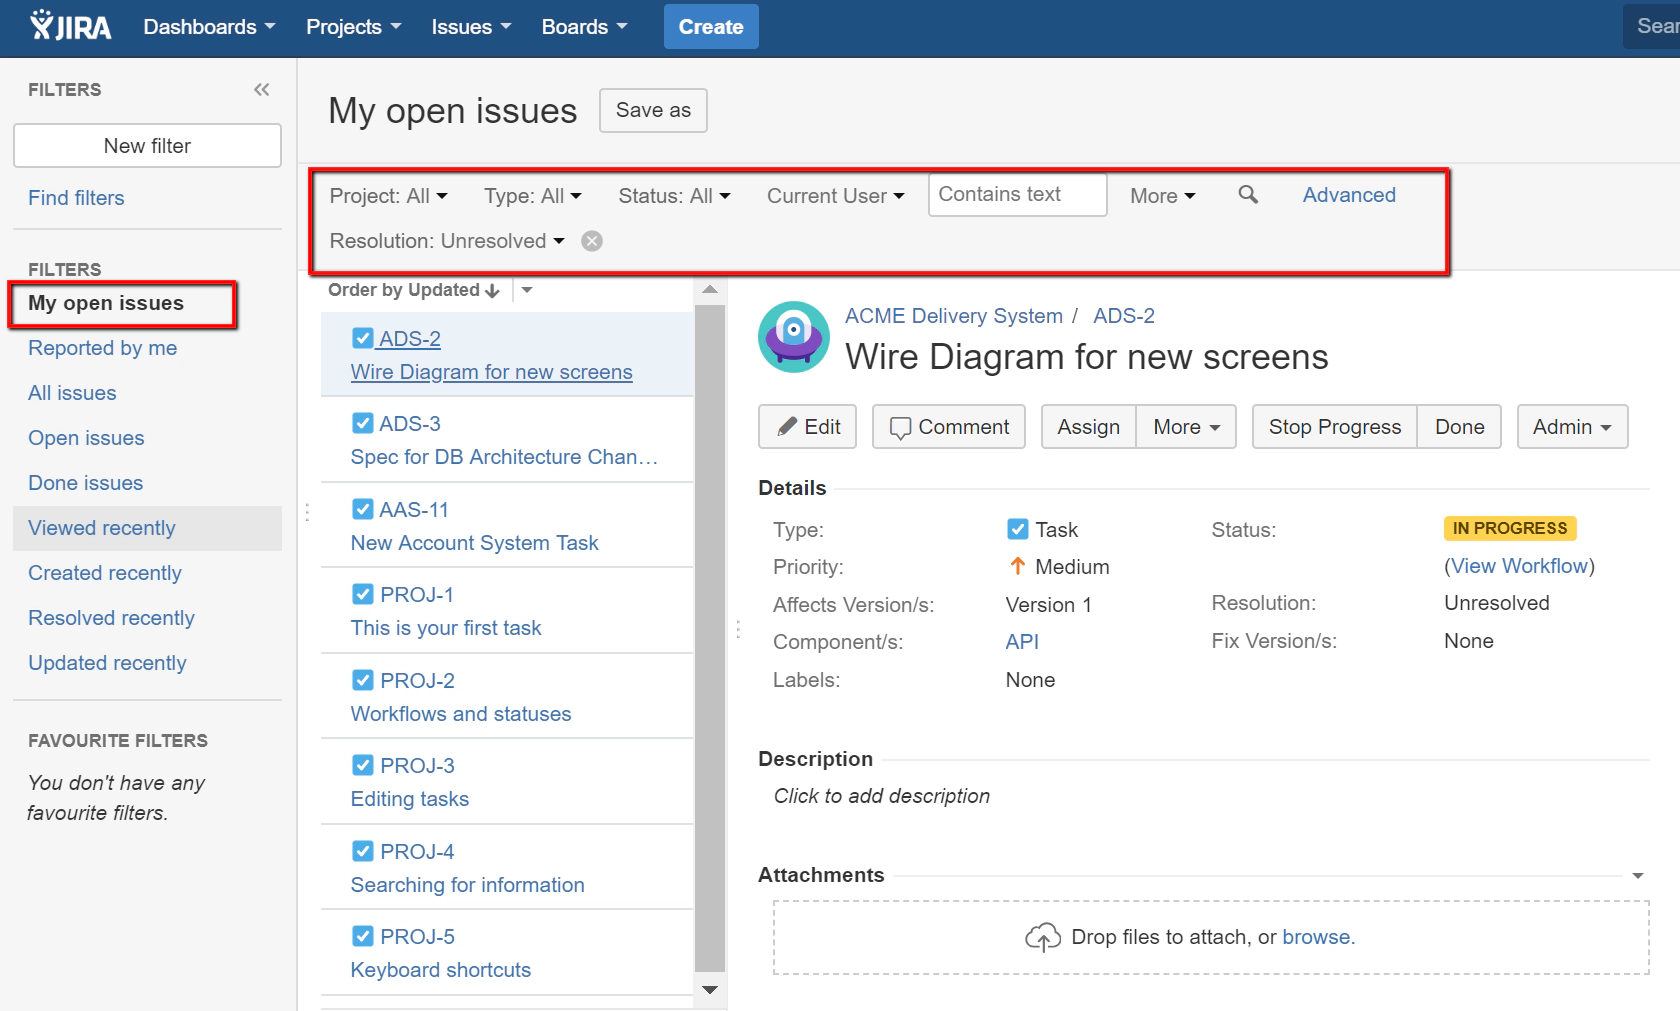
What this shows us is a pre-defined filter that is applying a set of search critera. The search criteria applied is just that “Assignee” is ‘Current user’ and “Resolution” is ‘Unresolved’ (e.g. the issue is still open). These search critreria are then saved as a filter called ‘My Open Issues’.
What we can do from here is create a slightly different version of this filter to show ‘My In Progress’ issues. We’ll define the search criteria first and then save this as a filter.
To create the search criteria for ‘My In Progress’ issues first update the search criteria. We’ll add the “Status” value of ‘In Progress’.
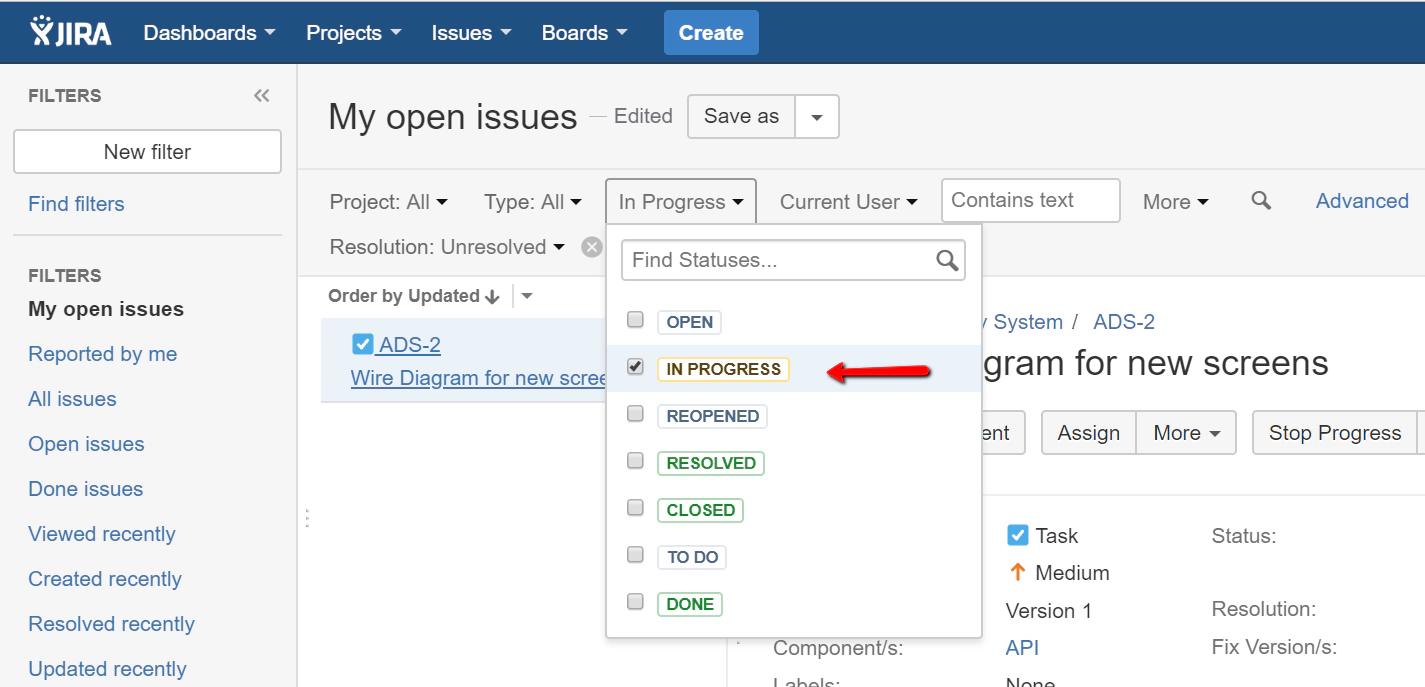
This gives us all our own issues that are clearly ‘In Progress’. Now we need to save this as a new filter. We can click the ‘Save as’ button at the top of the page now.

And from here give our filter a name and save it.
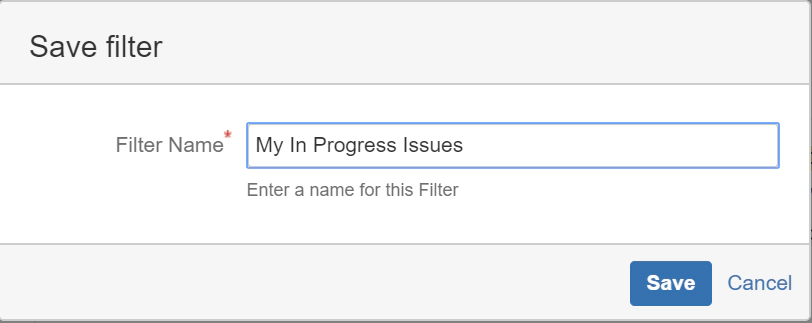
Now our newly configured filter will show up in both our ‘Favorite Filters’ list and our ‘Issues’ drop down menu.
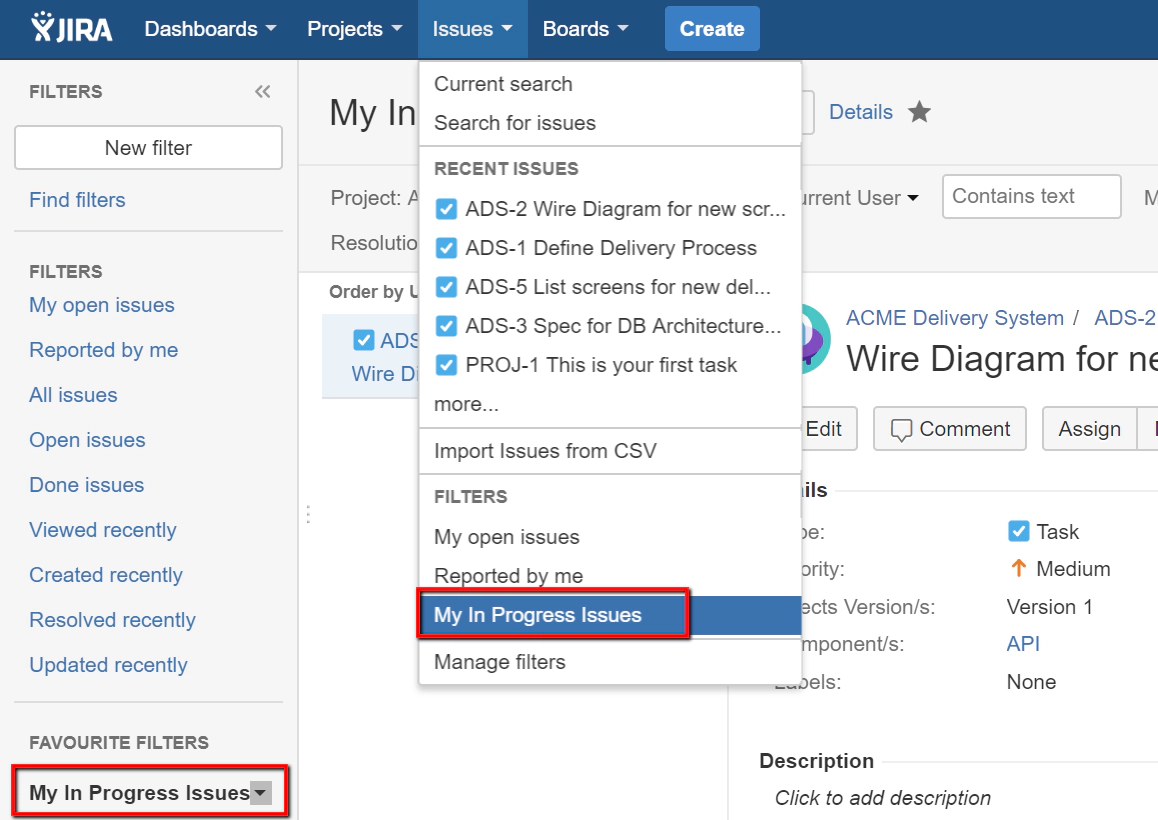
Whenever we need to see what issues we have in progress just select this filter to come back to this view. What’s really useful though is that we can go back to the dashboards and add a widget on the dashboard based on this filter.
Going back to our delivery sysetm dashboard:

Then adding a new gadget (click the ‘Add gadget’ button) and add the ‘Average Age’ gadget.
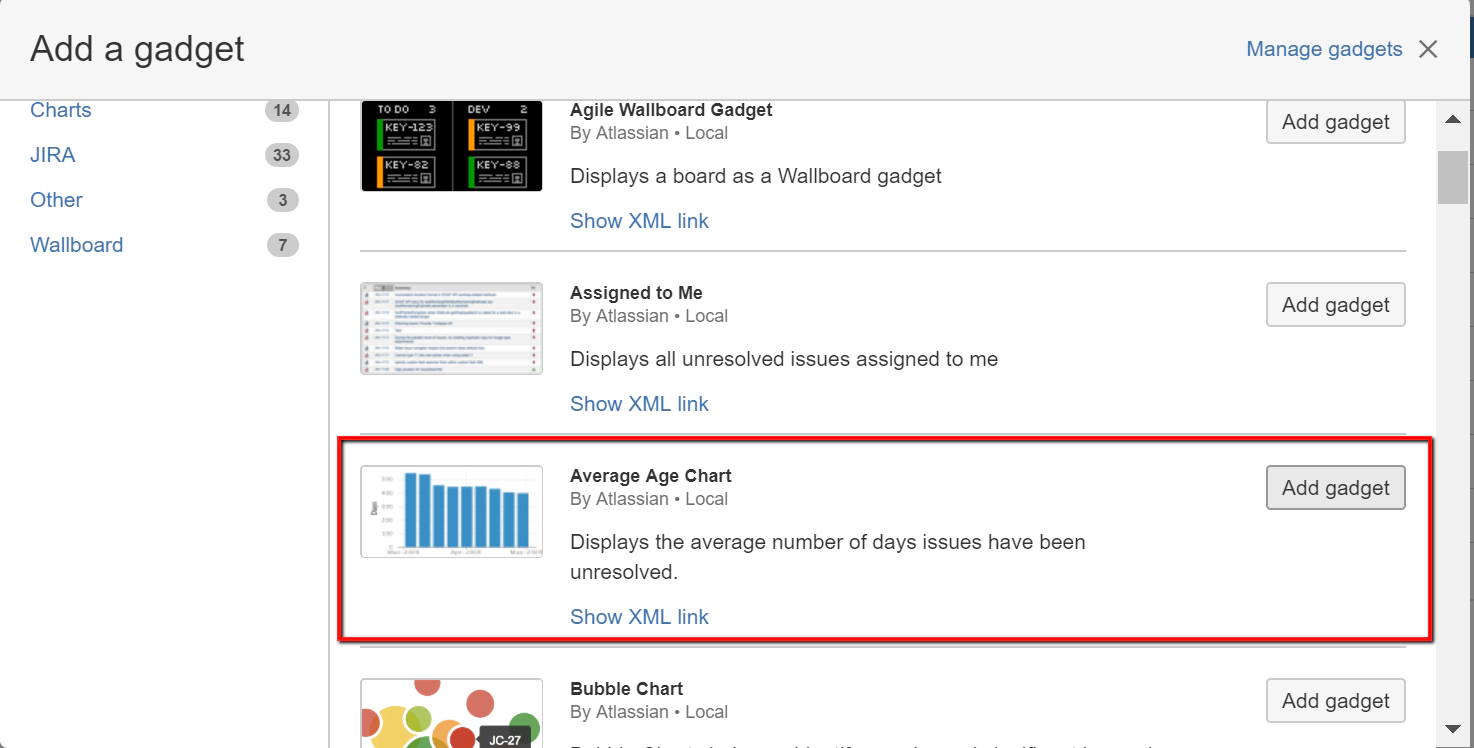
You’ll be presented with the configuration panel for the new Gadget. In here we want to specify the filter that we’ve just defined. We can type ‘My In Progress Issues’ into the filter field, leave the other fields as their default values and then click ‘save’.
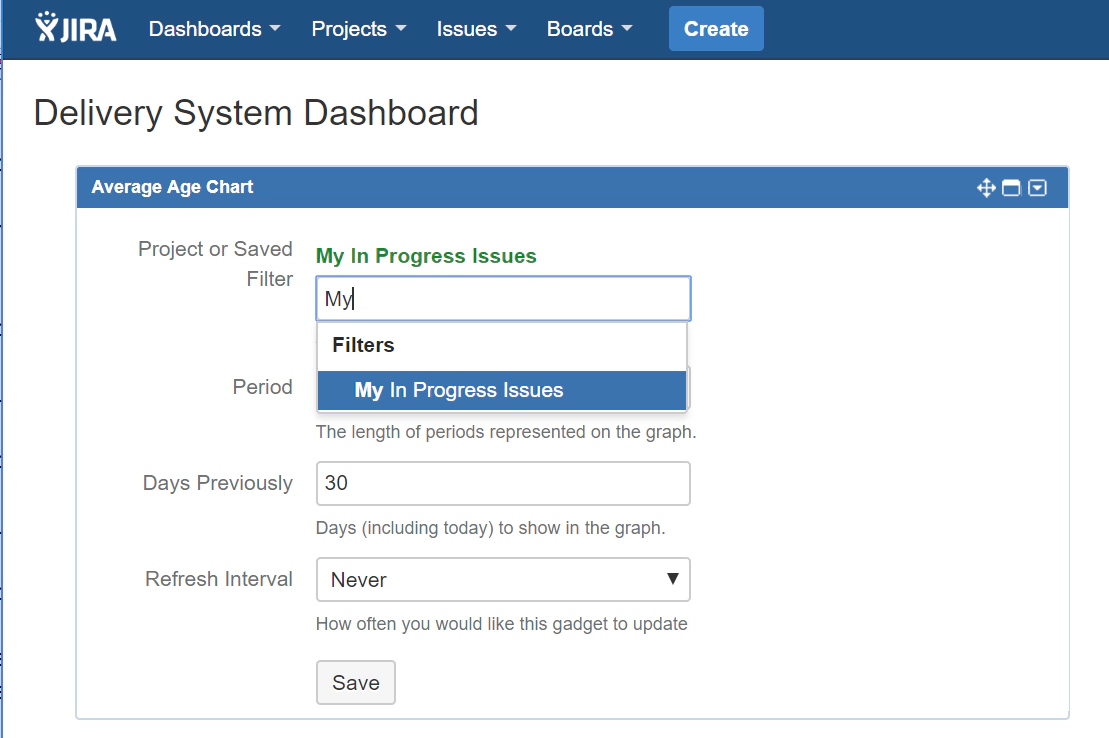
At this point we’ll see the graph for issue average age, but in this instance filtered and caculated based on just the issues we want to focus on.
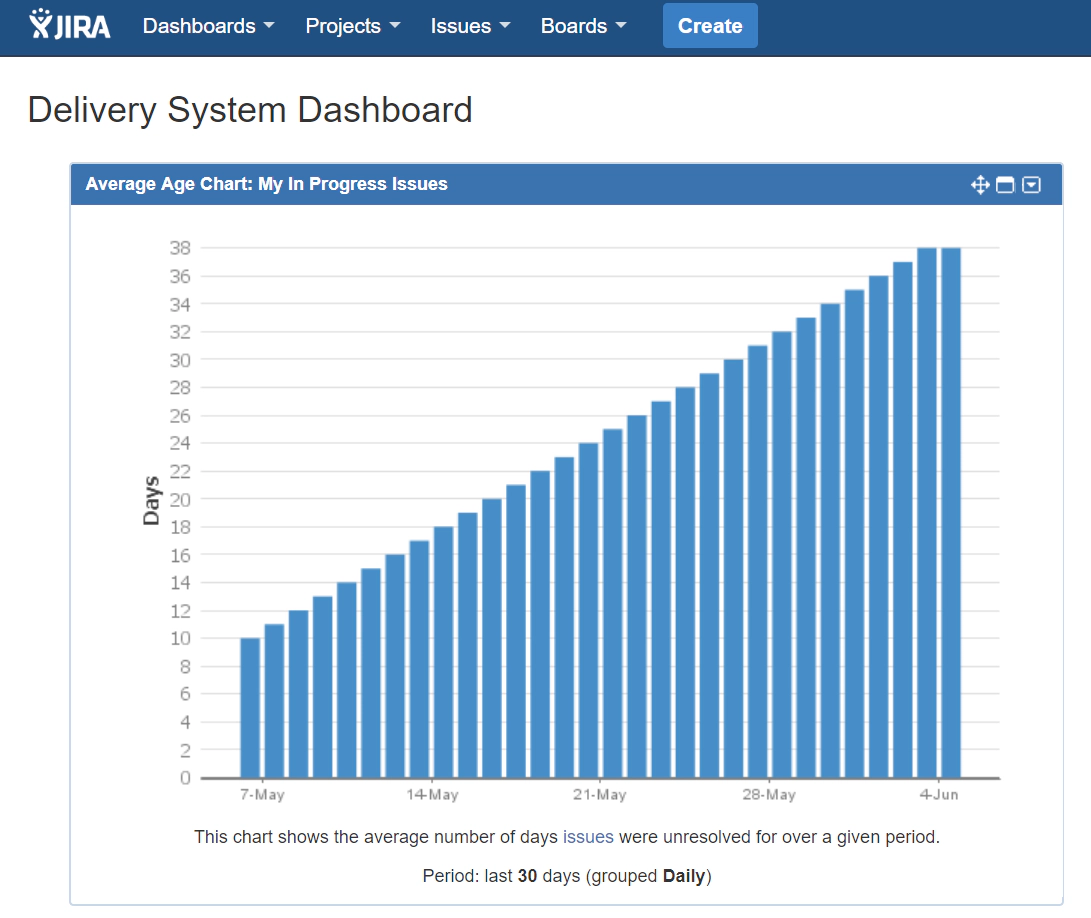
In this instance what we’re looking at might not be particularly useful, but it does highlight the end-to-end process of creating your own filters and then applying them to the dashboards.
Conclusion
Dashboards are a critical component for you to track progress and visualise the status of your projects.
In this module we’ve looked through how to create your own dashboards and seen how filters underpin those dashboards. The filters access the data that you need to generate your dashboards. Get the filters right and from there is just a question of picking and adding gadgets to your dashboards. Simple to implement once you understand the concepts and understand the steps involved.
In the next module we look in more detail at how to work with filters and how to use the advanced search features within Jira.
